MetLife 2006 Annual Report Download - page 33
Download and view the complete annual report
Please find page 33 of the 2006 MetLife annual report below. You can navigate through the pages in the report by either clicking on the pages listed below, or by using the keyword search tool below to find specific information within the annual report.-
 1
1 -
2
-
3
-
4
-
5
-
6
-
7
-
8
-
9
-
10
-
11
-
12
-
13
-
14
-
15
-
16
-
17
-
18
-
19
-
20
-
21
-
22
-
 23
23 -
 24
24 -
 25
25 -
 26
26 -
 27
27 -
 28
28 -
 29
29 -
 30
30 -
 31
31 -
 32
32 -
 33
33 -
 34
34 -
 35
35 -
 36
36 -
 37
37 -
 38
38 -
 39
39 -
 40
40 -
 41
41 -
 42
42 -
 43
43 -
44
-
45
-
46
-
47
-
48
-
49
-
50
-
51
-
52
-
53
-
54
-
55
-
56
-
57
-
58
-
59
-
60
-
61
-
62
-
63
-
64
-
65
-
66
-
67
-
68
-
69
-
70
-
71
-
72
-
73
-
74
-
75
-
76
-
77
-
78
-
79
-
80
-
81
-
82
-
83
-
84
-
85
-
86
-
87
-
88
-
89
-
90
-
91
-
92
-
93
-
94
-
95
-
96
-
97
-
98
-
99
-
100
-
101
-
102
-
103
-
104
-
105
-
106
-
107
-
108
-
109
-
110
-
111
-
112
-
113
-
114
-
115
-
116
-
117
-
118
-
119
-
120
-
121
-
122
-
123
-
124
-
125
-
126
-
127
-
128
-
129
-
130
-
131
-
132
-
133
-
134
-
135
-
136
-
137
-
138
-
139
-
140
-
141
-
142
-
143
-
144
-
145
-
146
-
147
-
148
-
149
-
150
-
151
-
152
-
153
-
154
-
155
-
156
-
157
-
158
-
159
-
160
-
161
-
162
-
163
-
164
-
165
-
166
 |
 |
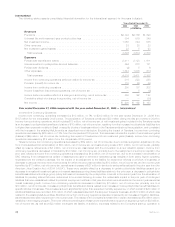
$19 million due to reserve strengthening in the prior year on a block of reinsurance business and a decrease in Chile of $7 million primarily
due to a decrease in annuity liabilities related to the decrease in the inflation index and the decrease in annuity premiums discussed above,
partially offset by growth in the institutional business, as well as the impact of foreign currency exchange rates of $17 million. Policyholder
benefits and claims, policyholder dividends, and interest credited to PABs decreased in Taiwan by $2 million primarily due to a decrease of
$14 million from reserve refinements associated with the implementation of a new valuation system, partially offset by an increase of
$12 million primarily due to business growth. Argentina’s policyholder benefits and claims, policyholder dividends, and interest credited to
PABs decreased by $2 million primarily due to the elimination of liabilities for pending claims that were determined to be invalid following a
review, partially offset by business growth. Increases in other countries accounted for the remainder of the change.
Other expenses increased by $330 million, or 33%, to $1,330 million for the year ended December 31, 2006 from $1,000 million for the
comparable 2005 period. Taiwan’s other expenses increased by $110 million primarily due to a one-time increase in DAC amortization of
$77 million due to a loss recognition adjustment resulting from low interest rates relative to product guarantees coupled with high
persistency rates on certain blocks of business, an increase of $17 million related to the termination of the agency distribution channel in
Taiwan, an increase of $9 million from refinements associated with the implementation of a new valuation system, as well as business
growth. Mexico’s other expenses increased by $49 million primarily due to an increase in commissions commensurate with the revenue
growth discussed above, higher DAC amortization resulting from management’s update of assumptions used to determine estimated gross
profits in both the current and prior years, higher expenses related to growth initiatives, and additional expenses associated with the
Mexican pension business, partially offset by the unfavorable impact of contingent liabilities that were established in the prior year related
to potential employment matters and which were eliminated in the current year. South Korea’s other expenses increased by $25 million,
primarily due to an increase in DAC amortization and general expenses, which were both due to the growth in business, the impact in the
prior year of an accrual for an early retirement program and the impact of foreign currency exchange rates of $15 million. These were
partially offset by a decrease of $60 million in DAC amortization associated with the implementation of a more refined reserve valuation
system. Brazil’s other expenses increased by $25 million primarily due to the growth in business discussed above, as well as an increase in
litigation liabilities. Chile’s other expenses increased by $13 million due to increased commissions and other expenses associated with its
institutional business, as well as the impact of foreign currency exchange rates of $4 million. Other expenses increased in the United
Kingdom and Australia by $15 million and $8 million, respectively, primarily due to business growth. Other expenses associated with the
home office increased by $57 million primarily due to an increase in expenditures for information technology projects, growth initiative
projects and integration costs, as well as an increase in compensation resulting from an increase in headcount from the comparable 2005
period. In addition, $34 million of expenses were incurred related to the start-up of the Company’s operation in Ireland. These increases
were partially offset by a decrease in other expenses of $9 million in Argentina primarily due to the favorable impact of foreign currency
exchange rates and inflation rates on certain contingent liabilities. Increases in other countries accounted for the remainder of the change.
Changes in foreign currency exchange rates accounted for $90 million of the increase in total expenses.
Year ended December 31, 2005 compared with the year ended December 31, 2004 — International
Income from Continuing Operations
Income from continuing operations decreased by $15 million, or 7%, to $187 million for the year ended December 31, 2005 from
$202 million for the comparable 2004 period. The acquisition of Travelers accounted for a loss from continuing operations of $24 million
including net investment losses of $14 million, net of income tax. Excluding the impact of the Travelers acquisition, income from continuing
operations increased by $9 million, or 4%, over the prior year.
South Korea’s income from continuing operations increased by $26 million, net of income tax, primarily due to growth in business,
specifically higher sales of its variable universal life product and a larger in-force business. Chile’s income from continuing operations
increased by $8 million primarily due to growth in business, specifically in the new bank distribution channel, as well as an increase in net
investment income primarily due to higher inflation rates. Mexico’s income from continuing operations increased by $8 million, primarily due
to tax benefits of $27 million under the AJCA, higher net investment earnings, an adjustment to the amortization of DAC for management’s
update of assumptions used to determine estimated gross margins and several other one-time revenue items. These increases in Mexico
were substantially offset by an increase in certain policyholder liabilities caused by unrealized investment losses on the invested assets
supporting those liabilities, as well as an increase in expenses for start up costs for the new Mexican Pension Business (“AFORE”) and
contingency liabilities.
Partially offsetting these increases in income from continuing operations was a decrease in Canada of $13 million, net of income tax,
primarily due to a realignment of economic capital, offset by the strengthening of the liability on its pension business related to changes in
mortality assumptions in the prior year and higher home office and infrastructure expenditures in support of the segment growth of
$16 million, net of income tax. The remainder of the variance can be attributed to various other countries.
Additionally, $4 million of the increase in income from continuing operations is due to changes in foreign currency exchange rates.
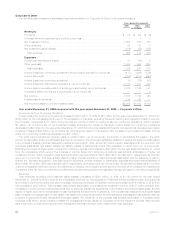
Revenues
Total revenues, excluding net investment gains (losses), increased by $982 million, or 37%, to $3,629 million for the year ended
December 31, 2005 from $2,647 million for the comparable 2004 period. The acquisition of Travelers accounted for $377 million of this
increase. Excluding the impact of the Travelers acquisition, total revenues, excluding net investment gains, increased by $605 million, or
23%, over the comparable 2004 period.
Premiums, fees and other revenues increased by $452 million, or 22%, to $2,514 million for the year ended December 31, 2005 from
$2,062 million for the comparable 2004 period. This increase is primarily the result of continued business growth through increased sales
and renewal business within South Korea, Brazil and Taiwan of $216 million, $48 million and $31 million, respectively. Mexico’s premiums,
fees and other revenues increased by $78 million primarily due to increases in the institutional and agency business channels, as well as
several one-time other revenue items of $19 million. Chile’s premiums, fees and other revenues increased by $64 million mainly due to its
new bank distribution channel.
Net investment income increased by $153 million, or 26%, to $738 million for the year ended December 31, 2005 from $585 million for
the comparable 2004 period. Mexico’s net investment income increased by $89 million due principally to increases in interest rates and
also as a result of an increase in invested assets. Chile’s net investment income increased by $58 million primarily due to higher inflation
30 MetLife, Inc.