MetLife 2006 Annual Report Download - page 159
Download and view the complete annual report
Please find page 159 of the 2006 MetLife annual report below. You can navigate through the pages in the report by either clicking on the pages listed below, or by using the keyword search tool below to find specific information within the annual report.-
 1
1 -
2
-
3
-
4
-
5
-
6
-
7
-
8
-
9
-
10
-
11
-
12
-
13
-
14
-
15
-
16
-
17
-
18
-
19
-
20
-
21
-
22
-
23
-
24
-
25
-
26
-
27
-
28
-
29
-
30
-
31
-
32
-
33
-
34
-
35
-
36
-
37
-
38
-
39
-
40
-
41
-
42
-
43
-
44
-
45
-
46
-
47
-
48
-
49
-
50
-
51
-
52
-
53
-
54
-
55
-
56
-
57
-
58
-
59
-
60
-
61
-
62
-
63
-
64
-
65
-
66
-
67
-
68
-
69
-
70
-
71
-
72
-
73
-
74
-
75
-
76
-
77
-
78
-
79
-
80
-
81
-
82
-
83
-
84
-
85
-
86
-
87
-
88
-
89
-
90
-
91
-
92
-
93
-
94
-
95
-
96
-
97
-
98
-
99
-
100
-
101
-
102
-
103
-
104
-
105
-
106
-
107
-
108
-
109
-
110
-
111
-
112
-
113
-
114
-
115
-
116
-
117
-
118
-
119
-
120
-
121
-
122
-
123
-
124
-
125
-
126
-
127
-
128
-
129
-
130
-
131
-
132
-
133
-
134
-
135
-
136
-
137
-
138
-
139
-
140
-
141
-
142
-
143
-
144
-
145
-
146
-
147
-
148
-
 149
149 -
 150
150 -
 151
151 -
 152
152 -
 153
153 -
 154
154 -
 155
155 -
 156
156 -
 157
157 -
 158
158 -
 159
159 -
 160
160 -
 161
161 -
 162
162 -
 163
163 -
 164
164 -
 165
165 -
 166
166
 |
 |

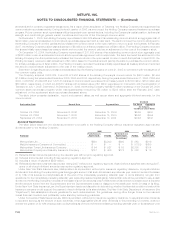
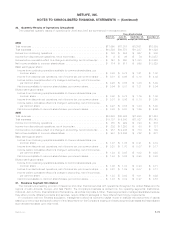
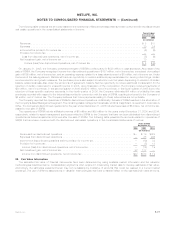
22. Discontinued Operations
Real Estate
The Company actively manages its real estate portfolio with the objective of maximizing earnings through selective acquisitions and
dispositions. Income related to real estate classified as held-for-sale or sold is presented in discontinued operations. These assets are
carried at the lower of depreciated cost or fair value less expected disposition costs.
The following information presents the components of income from discontinued real estate operations:
2006 2005 2004
Years Ended December 31,
(In millions)
Investmentincome..................................................... $ 234 $ 395 $649
Investmentexpense.................................................... (150) (244) (388)
Netinvestmentgains ................................................... 4,795 2,125 146
Totalrevenues ...................................................... 4,879 2,276 407
Interestexpense ...................................................... — — 13
Provisionforincometax ................................................. 1,723 808 138
Incomefromdiscontinuedoperations,netofincometax............................. $3,156 $1,468 $256
The carrying value of real estate related to discontinued operations was $7 million and $755 million at December 31, 2006 and 2005,
respectively.
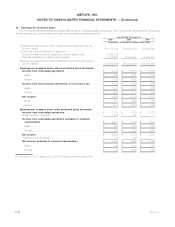
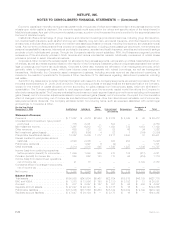
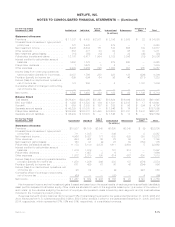
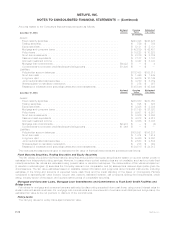
The following table presents the discontinued real estate operations by segment:
2006 2005 2004
Years Ended December 31,
(In millions)
Net investment income
Institutional......................................................... $ 6 $ 28 $ 37
Individual.......................................................... 4 20 30
Corporate&Other .................................................... 74 103 194
Totalnetinvestmentincome ............................................ $ 84 $ 151 $261
Net investment gains (losses)
Institutional......................................................... $ 58 $ 242 $ 9
Individual.......................................................... 23 443 3
Corporate&Other .................................................... 4,714 1,440 134
Totalnetinvestmentgains(losses) ........................................ $4,795 $2,125 $146
Interest expense
Institutional......................................................... $ — $ — $ —
Individual.......................................................... — — —
Corporate&Other .................................................... — — 13
Totalinterestexpense............................................... $ — $ — $ 13
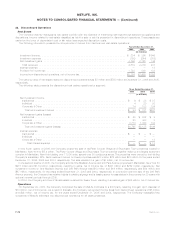
In the fourth quarter of 2006, the Company closed the sale of its Peter Cooper Village and Stuyvesant Town properties located in
Manhattan, New York for $5.4 billion. The Peter Cooper Village and Stuyvesant Town properties together make up the largest apartment
complex in Manhattan, New York totaling over 11,000 units, spread over 80 contiguous acres. The properties were owned by the Holding
Company’s subsidiary, MTL. Net investment income on these properties was $73 million, $72 million and $70 million for the years ended
December 31, 2006, 2005 and 2004, respectively. The sale resulted in a gain of $3 billion, net of income tax.
In the second quarter of 2005, the Company sold its One Madison Avenue and 200 Park Avenue properties in Manhattan, New York for
$918 million and $1.72 billion, respectively, resulting in gains, net of income tax, of $431 million and $762 million, respectively. Net
investment income on One Madison Avenue and 200 Park Avenue was $13 million and $16 million, respectively, and $44 million and
$67 million, respectively, for the years ended December 31, 2005 and 2004, respectively. In connection with the sale of the 200 Park
Avenue property, the Company has retained rights to existing signage and is leasing space for associates in the property for 20 years with
optional renewal periods through 2205.
In 2004, the Company sold one of its real estate investments, Sears Tower, resulting in a realized gain of $85 million, net of income tax.
Operations
On September 29, 2005, the Company completed the sale of MetLife Indonesia to a third party, resulting in a gain upon disposal of
$10 million, net of income tax. As a result of this sale, the Company recognized income (loss) from discontinued operations of $5 million
and ($9) million, net of income tax, for the years ended December 31, 2005 and 2004, respectively. The Company reclassified the
operations of MetLife Indonesia into discontinued operations for all years presented.
F-76 MetLife, Inc.
METLIFE, INC.
NOTES TO CONSOLIDATED FINANCIAL STATEMENTS — (Continued)