MetLife 2006 Annual Report Download - page 111
Download and view the complete annual report
Please find page 111 of the 2006 MetLife annual report below. You can navigate through the pages in the report by either clicking on the pages listed below, or by using the keyword search tool below to find specific information within the annual report.-
 1
1 -
2
-
3
-
4
-
5
-
6
-
7
-
8
-
9
-
10
-
11
-
12
-
13
-
14
-
15
-
16
-
17
-
18
-
19
-
20
-
21
-
22
-
23
-
24
-
25
-
26
-
27
-
28
-
29
-
30
-
31
-
32
-
33
-
34
-
35
-
36
-
37
-
38
-
39
-
40
-
41
-
42
-
43
-
44
-
45
-
46
-
47
-
48
-
49
-
50
-
51
-
52
-
53
-
54
-
55
-
56
-
57
-
58
-
59
-
60
-
61
-
62
-
63
-
64
-
65
-
66
-
67
-
68
-
69
-
70
-
71
-
72
-
73
-
74
-
75
-
76
-
77
-
78
-
79
-
80
-
81
-
82
-
83
-
84
-
85
-
86
-
87
-
88
-
89
-
90
-
91
-
92
-
93
-
94
-
95
-
96
-
97
-
98
-
99
-
100
-
 101
101 -
 102
102 -
 103
103 -
 104
104 -
 105
105 -
 106
106 -
 107
107 -
 108
108 -
 109
109 -
 110
110 -
 111
111 -
 112
112 -
 113
113 -
 114
114 -
 115
115 -
 116
116 -
 117
117 -
 118
118 -
 119
119 -
 120
120 -
 121
121 -
122
-
123
-
124
-
125
-
126
-
127
-
128
-
129
-
130
-
131
-
132
-
133
-
134
-
135
-
136
-
137
-
138
-
139
-
140
-
141
-
142
-
143
-
144
-
145
-
146
-
147
-
148
-
149
-
150
-
151
-
152
-
153
-
154
-
155
-
156
-
157
-
158
-
159
-
160
-
161
-
162
-
163
-
164
-
165
-
166
 |
 |

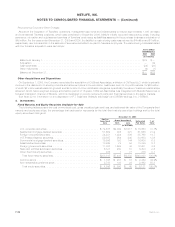
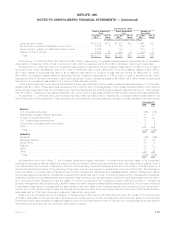
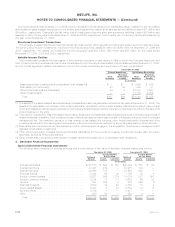
Unrealized Loss for Fixed Maturity and Equity Securities Available-for-Sale
The following tables present the estimated fair values and gross unrealized loss of the Company’s fixed maturity securities (aggregated
by sector) and equity securities in an unrealized loss position, aggregated by length of time that the securities have been in a continuous
unrealized loss position at:
Estimated
Fair
Value
Gross
Unrealized
Loss
Estimated
Fair
Value
Gross
Unrealized
Loss
Estimated
Fair
Value
Gross
Unrealized
Loss
Less than 12 months Equal to or Greater than
12 months Total
December 31, 2006
(In millions, except number of securities)
U.S.corporatesecurities......................... $17,899 $304 $16,974 $ 713 $ 34,873 $1,017
Residential mortgage-backed securities . . . . . . . . . . . . . . . . 15,300 78 13,640 243 28,940 321
Foreign corporate securities . . . . . . . . . . . . . . . . . . . . . . . 6,753 105 7,579 281 14,332 386
U.S. Treasury/agency securities . . . . . . . . . . . . . . . . . . . . . 15,006 157 1,560 91 16,566 248
Commercial mortgage-backed securities . . . . . . . . . . . . . . . 4,976 31 4,096 113 9,072 144
Asset-backedsecurities.......................... 4,528 31 1,084 23 5,612 54
Foreigngovernmentsecurities...................... 1,162 18 507 16 1,669 34
State and political subdivision securities . . . . . . . . . . . . . . . 334 12 532 39 866 51
Otherfixedmaturitysecurities...................... 146 77 4 — 150 77
Total fixed maturity securities . . . . . . . . . . . . . . . . . . . . . $66,104 $813 $45,976 $1,519 $112,080 $2,332
Equitysecurities............................... $ 842 $ 20 $ 575 $ 25 $ 1,417 $ 45
Total number of securities in an unrealized loss position . . . . . 11,021 4,793 15,814
Estimated
Fair
Value
Gross
Unrealized
Loss
Estimated
Fair
Value
Gross
Unrealized
Loss
Estimated
Fair
Value
Gross
Unrealized
Loss
Less than 12 months Equal to or Greater than
12 months Total
December 31, 2005
(In millions, except number of securities)
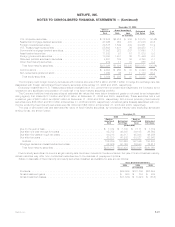
U.S.corporatesecurities......................... $29,095 $ 740 $2,685 $ 98 $ 31,780 $ 838
Residential mortgage-backed securities . . . . . . . . . . . . . . . . 31,258 434 1,291 38 32,549 472
Foreign corporate securities . . . . . . . . . . . . . . . . . . . . . . . 13,185 378 1,728 61 14,913 439
U.S.Treasury/agencysecurities..................... 7,759 85 113 1 7,872 86
Commercial mortgage-backed securities . . . . . . . . . . . . . . . 10,190 185 685 22 10,875 207
Asset-backedsecurities.......................... 4,709 42 305 9 5,014 51
Foreigngovernmentsecurities...................... 1,203 31 327 4 1,530 35
State and political subdivision securities . . . . . . . . . . . . . . . 1,050 36 16 — 1,066 36
Otherfixedmaturitysecurities...................... 319 36 52 5 371 41
Total fixed maturity securities . . . . . . . . . . . . . . . . . . . . . $98,768 $1,967 $7,202 $238 $105,970 $2,205
Equitysecurities............................... $ 671 $ 34 $ 131 $ 7 $ 802 $ 41
Total number of securities in an unrealized loss position . . . . . 12,787 932 13,719
Aging of Gross Unrealized Loss for Fixed Maturity and Equity Securities Available-for-Sale
The following tables present the cost or amortized cost, gross unrealized loss and number of securities for fixed maturity securities and
equity securities, where the estimated fair value had declined and remained below cost or amortized cost by less than 20%, or 20% or more
at:
Less than
20% 20% or
more Less than
20% 20% or
more Less than
20% 20% or
more
Cost or Amortized
Cost Gross Unrealized
Loss Number of
Securities
December 31, 2006
(In millions, except number of securities)
Lessthansixmonths............................. $ 52,384 $36 $ 549 $12 9,240 83
Sixmonthsorgreaterbutlessthanninemonths ........... 3,143 3 56 1 706 2
Nine months or greater but less than twelve months . . . . . . . . . 12,199 14 211 4 989 1
Twelvemonthsorgreater .......................... 48,066 29 1,537 7 4,787 6
Total ...................................... $115,792 $82 $2,353 $24 15,722 92
F-28 MetLife, Inc.
METLIFE, INC.
NOTES TO CONSOLIDATED FINANCIAL STATEMENTS — (Continued)