MetLife 2006 Annual Report Download - page 146
Download and view the complete annual report
Please find page 146 of the 2006 MetLife annual report below. You can navigate through the pages in the report by either clicking on the pages listed below, or by using the keyword search tool below to find specific information within the annual report.-
 1
1 -
2
-
3
-
4
-
5
-
6
-
7
-
8
-
9
-
10
-
11
-
12
-
13
-
14
-
15
-
16
-
17
-
18
-
19
-
20
-
21
-
22
-
23
-
24
-
25
-
26
-
27
-
28
-
29
-
30
-
31
-
32
-
33
-
34
-
35
-
36
-
37
-
38
-
39
-
40
-
41
-
42
-
43
-
44
-
45
-
46
-
47
-
48
-
49
-
50
-
51
-
52
-
53
-
54
-
55
-
56
-
57
-
58
-
59
-
60
-
61
-
62
-
63
-
64
-
65
-
66
-
67
-
68
-
69
-
70
-
71
-
72
-
73
-
74
-
75
-
76
-
77
-
78
-
79
-
80
-
81
-
82
-
83
-
84
-
85
-
86
-
87
-
88
-
89
-
90
-
91
-
92
-
93
-
94
-
95
-
96
-
97
-
98
-
99
-
100
-
101
-
102
-
103
-
104
-
105
-
106
-
107
-
108
-
109
-
110
-
111
-
112
-
113
-
114
-
115
-
116
-
117
-
118
-
119
-
120
-
121
-
122
-
123
-
124
-
125
-
126
-
127
-
128
-
129
-
130
-
131
-
132
-
133
-
134
-
135
-
 136
136 -
 137
137 -
 138
138 -
 139
139 -
 140
140 -
 141
141 -
 142
142 -
 143
143 -
 144
144 -
 145
145 -
 146
146 -
 147
147 -
 148
148 -
 149
149 -
 150
150 -
 151
151 -
 152
152 -
 153
153 -
 154
154 -
 155
155 -
 156
156 -
157
-
158
-
159
-
160
-
161
-
162
-
163
-
164
-
165
-
166
 |
 |

2006 2005 2004
Years Ended
December 31,
(In millions)
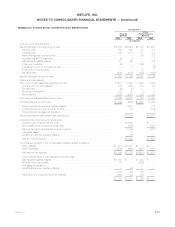
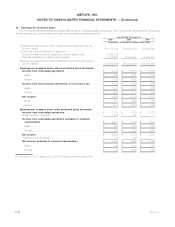
Reduction in net periodic benefit cost:
Servicecost............................................................. $ 6 $ 6 $ 3
Interestcost............................................................. 19 16 6
Amortizationofnetactuarialgains(losses) ......................................... 30 23 8
Totalreductioninnetperiodicbenefitcost........................................ $55 $45 $17
The Company received subsidies of $8 million for prescription claims processed from January 1, 2006 through September 30, 2006
and expects to receive an additional $2 million in 2007 for prescription claims processed October 1, 2006 through December 31, 2006.
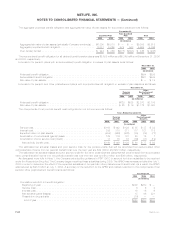
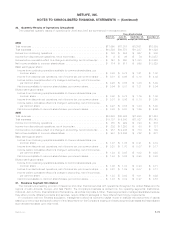
Assumptions
Assumptions used in determining benefit obligations were as follows:
2006 2005 2006 2005
Pension
Benefits
Other
Postretirement
Benefits
December 31,
Weightedaveragediscountrate...................................... 6.00% 5.82% 6.00% 5.82%
Rateofcompensationincrease ...................................... 3%-8% 3%-8% N/A N/A
Assumptions used in determining net periodic benefit cost were as follows:
2006 2005 2004 2006 2005 2004
Pension Benefits Other Postretirement
Benefits
December 31,
Weighted average discount rate . . . . . . . . . . . . . . . . . . . . . . . . . 5.82% 5.83% 6.10% 5.82% 5.98% 6.20%
Weighted average expected rate of return on plan assets . . . . . . . . 8.25% 8.50% 8.50% 7.42% 7.51% 7.91%
Rateofcompensationincrease ......................... 3%-8% 3%-8% 3%-8% N/A N/A N/A
The discount rate is based on the yield of a hypothetical portfolio constructed of bonds rated AA or better by Moody’s Investors Services
available on the valuation date measured on a yield to worst basis, which would provide the necessary future cash flows to pay the
aggregate projected benefit obligation when due.
Theexpectedrateofreturnonplanassetsisbasedonanticipatedperformanceofthevariousassetsectorsinwhichtheplaninvests,
weighted by target allocation percentages. Anticipated future performance is based on long-term historical returns of the plan assets by
sector, adjusted for the Subsidiaries’ long-term expectations on the performance of the markets. While the precise expected return derived
using this approach will fluctuate from year to year, the Subsidiaries’ policy is to hold this long-term assumption constant as long as it
remains within reasonable tolerance from the derived rate.
The weighted average expected return on plan assets for use in that plan’s valuation in 2007 is currently anticipated to be 8.25% for
pension benefits and postretirement medical benefits and 6.25% for postretirement life benefits.
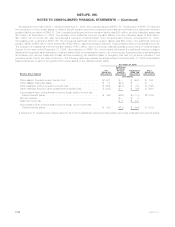
The assumed healthcare cost trend rates used in measuring the APBO and net periodic benefit cost were as follows:
2006 2005
December 31,
Pre-Medicareeligibleclaims.......................... 9.0%downto5%in2014 9.5%downto5%in2014
Medicare eligible claims . . . . . . . . . . . . . . . . . . . . . . . . . . . . . 11.0% down to 5% in 2018 11.5% down to 5% in 2018
Assumed healthcare cost trend rates may have a significant effect on the amounts reported for healthcare plans. A one-percentage
point change in assumed healthcare cost trend rates would have the following effects:
One Percent
Increase One Percent
Decrease
(In millions)
Effectontotalofserviceandinterestcostcomponents .............................. $ 14 $ (12)
Effect of accumulated postretirement benefit obligation . . . . . . . . . . . . . . . . . . . . . . . . . . . . . . $176 $(147)
Plan Assets
The Subsidiaries have issued group annuity and life insurance contracts supporting approximately 98% of all pension and other
postretirement benefit plans assets.
The account values of the group annuity and life insurance contracts issued by the Subsidiaries and held as assets of the pension and
other postretirement benefit plans were $7,321 million and $6,471 million as of December 31, 2006 and 2005, respectively. The majority of
such account values are held in separate accounts established by the Subsidiaries. Total revenue from these contracts recognized in the
consolidated statements of income was $29 million, $28 million and $28 million for the years ended December 31, 2006, 2005 and 2004,
respectively, and includes policy charges, net investment income from investments backing the contracts and administrative fees. Total
F-63MetLife, Inc.
METLIFE, INC.
NOTES TO CONSOLIDATED FINANCIAL STATEMENTS — (Continued)