MetLife 2006 Annual Report Download - page 6
Download and view the complete annual report
Please find page 6 of the 2006 MetLife annual report below. You can navigate through the pages in the report by either clicking on the pages listed below, or by using the keyword search tool below to find specific information within the annual report.-
 1
1 -
 2
2 -
 3
3 -
 4
4 -
 5
5 -
 6
6 -
 7
7 -
 8
8 -
 9
9 -
 10
10 -
 11
11 -
 12
12 -
 13
13 -
 14
14 -
 15
15 -
 16
16 -
 17
17 -
18
-
19
-
20
-
21
-
22
-
23
-
24
-
25
-
26
-
27
-
28
-
29
-
30
-
31
-
32
-
33
-
34
-
35
-
36
-
37
-
38
-
39
-
40
-
41
-
42
-
43
-
44
-
45
-
46
-
47
-
48
-
49
-
50
-
51
-
52
-
53
-
54
-
55
-
56
-
57
-
58
-
59
-
60
-
61
-
62
-
63
-
64
-
65
-
66
-
67
-
68
-
69
-
70
-
71
-
72
-
73
-
74
-
75
-
76
-
77
-
78
-
79
-
80
-
81
-
82
-
83
-
84
-
85
-
86
-
87
-
88
-
89
-
90
-
91
-
92
-
93
-
94
-
95
-
96
-
97
-
98
-
99
-
100
-
101
-
102
-
103
-
104
-
105
-
106
-
107
-
108
-
109
-
110
-
111
-
112
-
113
-
114
-
115
-
116
-
117
-
118
-
119
-
120
-
121
-
122
-
123
-
124
-
125
-
126
-
127
-
128
-
129
-
130
-
131
-
132
-
133
-
134
-
135
-
136
-
137
-
138
-
139
-
140
-
141
-
142
-
143
-
144
-
145
-
146
-
147
-
148
-
149
-
150
-
151
-
152
-
153
-
154
-
155
-
156
-
157
-
158
-
159
-
160
-
161
-
162
-
163
-
164
-
165
-
166
 |
 |

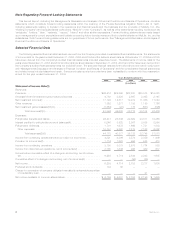
2006 2005 2004 2003 2002
December 31,
(In millions)
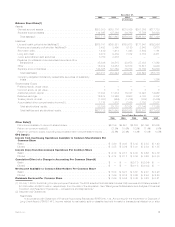
Balance Sheet Data(1)
Assets:
Generalaccountassets............................... $383,350 $353,776 $270,039 $251,085 $217,733
Separate account assets . . . . . . . . . . . . . . . . . . . . . . . . . . . . . . 144,365 127,869 86,769 75,756 59,693
Totalassets(2).................................... $527,715 $481,645 $356,808 $326,841 $277,426
Liabilities:
Life and health policyholder liabilities(7) . . . . . . . . . . . . . . . . . . . . . $268,741 $258,881 $193,612 $177,947 $162,986
Property and casualty policyholder liabilities(7) . . . . . . . . . . . . . . . . 3,453 3,490 3,180 2,943 2,673
Short-termdebt.................................... 1,449 1,414 1,445 3,642 1,161
Long-termdebt .................................... 9,979 9,489 7,412 5,703 4,411
Juniorsubordinateddebtsecurities ....................... 3,780 2,533 — — —
Payables for collateral under securities loaned and other
transactions..................................... 45,846 34,515 28,678 27,083 17,862
Other........................................... 16,304 14,353 12,888 12,618 9,990
Separate account liabilities . . . . . . . . . . . . . . . . . . . . . . . . . . . . . 144,365 127,869 86,769 75,756 59,693
Total liabilities(2) . . . . . . . . . . . . . . . . . . . . . . . . . . . . . . . . . . 493,917 452,544 333,984 305,692 258,776
Company-obligated mandatorily redeemable securities of subsidiary
trusts.........................................————1,265
Stockholders’ Equity
Preferredstock,atparvalue............................ 1 1 — — —
Commonstock,atparvalue............................88888
Additional paid-in capital . . . . . . . . . . . . . . . . . . . . . . . . . . . . . . 17,454 17,274 15,037 14,991 14,968
Retainedearnings................................... 16,574 10,865 6,608 4,193 2,807
Treasurystock,atcost................................ (1,357) (959) (1,785) (835) (2,405)
Accumulated other comprehensive income(8) . . . . . . . . . . . . . . . . . 1,118 1,912 2,956 2,792 2,007
Totalstockholders’equity............................. 33,798 29,101 22,824 21,149 17,385
Total liabilities and stockholders’ equity . . . . . . . . . . . . . . . . . . . . $527,715 $481,645 $356,808 $326,841 $277,426
2006 2005 2004 2003 2002
Years Ended December 31,
Other Data(1)
Netincomeavailabletocommonshareholders......................... $6,159 $4,651 $2,758 $2,196 $1,605
Returnoncommonequity(9) .................................... 21.9% 18.5% 12.5% 11.4% 9.6%
Return on common equity, excluding accumulated other comprehensive income . . . 22.6% 20.4% 14.4% 13.0% 10.8%
EPS Data(1)
Income from Continuing Operations Available to Common Shareholders Per
Common Share
Basic ................................................... $ 3.90 $ 4.03 $ 3.43 $ 2.38 $ 1.40
Diluted .................................................. $ 3.85 $ 3.99 $ 3.41 $ 2.34 $ 1.35
Income (loss) from Discontinued Operations Per Common Share
Basic ................................................... $ 4.19 $ 2.18 $ 0.35 $ 0.63 $ 0.88
Diluted .................................................. $ 4.14 $ 2.17 $ 0.35 $ 0.63 $ 0.85
Cumulative Effect of a Change in Accounting Per Common Share(6)
Basic ................................................... $ — $ — $(0.11) $(0.04) $ —
Diluted .................................................. $ — $ — $(0.11) $(0.03) $ —
Net Income Available to Common Shareholders Per Common Share
Basic ................................................... $ 8.09 $ 6.21 $ 3.67 $ 2.97 $ 2.28
Diluted .................................................. $ 7.99 $ 6.16 $ 3.65 $ 2.94 $ 2.20
Dividends Declared Per Common Share ........................... $ 0.59 $ 0.52 $ 0.46 $ 0.23 $ 0.21
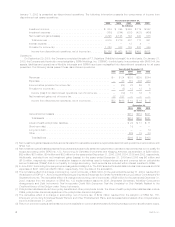
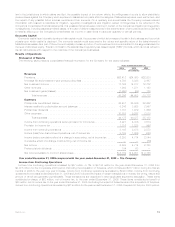
(1) On July 1, 2005, the Holding Company acquired Travelers. The 2005 selected financial data includes total revenues and total expenses of
$1,009 million and $618 million, respectively, from the date of the acquisition. See “Management’s Discussion and Analysis of Financial
Condition and Results of Operations — Acquisitions and Dispositions.”
(2) Discontinued Operations:
Real Estate
In accordance with Statement of Financial Accounting Standards (“SFAS”) No. 144, Accounting for the Impairment or Disposal of
Long-Lived Assets (“SFAS 144”), income related to real estate sold or classified as held-for-sale for transactions initiated on or after
3MetLife, Inc.