MetLife 2006 Annual Report Download - page 26
Download and view the complete annual report
Please find page 26 of the 2006 MetLife annual report below. You can navigate through the pages in the report by either clicking on the pages listed below, or by using the keyword search tool below to find specific information within the annual report.-
 1
1 -
2
-
3
-
4
-
5
-
6
-
7
-
8
-
9
-
10
-
11
-
12
-
13
-
14
-
15
-
 16
16 -
 17
17 -
 18
18 -
 19
19 -
 20
20 -
 21
21 -
 22
22 -
 23
23 -
 24
24 -
 25
25 -
 26
26 -
 27
27 -
 28
28 -
 29
29 -
 30
30 -
 31
31 -
 32
32 -
 33
33 -
 34
34 -
 35
35 -
 36
36 -
37
-
38
-
39
-
40
-
41
-
42
-
43
-
44
-
45
-
46
-
47
-
48
-
49
-
50
-
51
-
52
-
53
-
54
-
55
-
56
-
57
-
58
-
59
-
60
-
61
-
62
-
63
-
64
-
65
-
66
-
67
-
68
-
69
-
70
-
71
-
72
-
73
-
74
-
75
-
76
-
77
-
78
-
79
-
80
-
81
-
82
-
83
-
84
-
85
-
86
-
87
-
88
-
89
-
90
-
91
-
92
-
93
-
94
-
95
-
96
-
97
-
98
-
99
-
100
-
101
-
102
-
103
-
104
-
105
-
106
-
107
-
108
-
109
-
110
-
111
-
112
-
113
-
114
-
115
-
116
-
117
-
118
-
119
-
120
-
121
-
122
-
123
-
124
-
125
-
126
-
127
-
128
-
129
-
130
-
131
-
132
-
133
-
134
-
135
-
136
-
137
-
138
-
139
-
140
-
141
-
142
-
143
-
144
-
145
-
146
-
147
-
148
-
149
-
150
-
151
-
152
-
153
-
154
-
155
-
156
-
157
-
158
-
159
-
160
-
161
-
162
-
163
-
164
-
165
-
166
 |
 |

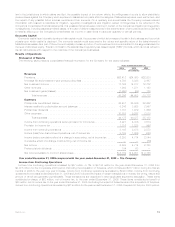
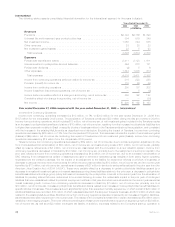
Individual
The following table presents consolidated financial information for the Individual segment for the years indicated:
2006 2005 2004
Years Ended December 31,
(In millions)
Revenues
Premiums.................................................. $ 4,516 $ 4,485 $ 4,186
Universallifeandinvestment-typeproductpolicyfees..................... 3,201 2,476 1,805
Netinvestmentincome......................................... 6,912 6,534 6,027
Otherrevenues.............................................. 527 477 422
Netinvestmentgains(losses)..................................... (598) (50) 91
Totalrevenues............................................. 14,558 13,922 12,531
Expenses
Policyholderbenefitsandclaims................................... 5,409 5,417 5,100
Interest credited to policyholder account balances . . . . . . . . . . . . . . . . . . . . . . . 2,035 1,775 1,618
Policyholderdividends ......................................... 1,697 1,670 1,657
Otherexpenses.............................................. 3,519 3,264 2,870
Totalexpenses............................................. 12,660 12,126 11,245
Income from continuing operations before provision for income tax. . . . . . . . . . . . . 1,898 1,796 1,286
Provisionforincometax ........................................ 652 594 426
Incomefromcontinuingoperations ................................. 1,246 1,202 860
Income(loss)fromdiscontinuedoperations,netofincometax ............... 18 296 24
Netincome ................................................ $ 1,264 $ 1,498 $ 884
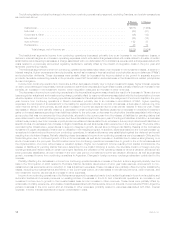
Year ended December 31, 2006 compared with the year ended December 31, 2005 — Individual
Income from Continuing Operations
Income from continuing operations increased by $44 million, or 4%, to $1,246 million for the year ended December 31, 2006 from
$1,202 million for the comparable 2005 period. The acquisition of Travelers contributed $112 million during the first six months of 2006 to
income from continuing operations, which included $88 million, net of income tax, of net investment losses. Included in the Travelers
results was a $21 million increase to the excess mortality liability on specific blocks of life insurance policies. Excluding the impact of
Travelers, income from continuing operations decreased by $68 million, or 6%, to $1,134 million for the year ended December 31, 2006
from $1,202 million for the comparable 2005 period. Included in this decrease were net investment losses of $270 million, net of income
tax. Excluding the impact of net investment gains (losses) and the acquisition of Travelers for the first six months of 2006, income from
continuing operations increased by $202 million from the comparable 2005 period.
Fee income from separate account products increased income from continuing operations by $151 million, net of income tax, primarily
related to fees being earned on a higher average account balance resulting from a combination of growth in the business and overall
market performance.
Favorable underwriting results in life products contributed $125 million, net of income tax, to the increase in income from continuing
operations. Underwriting results are generally the difference between the portion of premium and fee income intended to cover mortality,
morbidity or other insurance costs less claims incurred and the change in insurance-related liabilities. Underwriting results are significantly
influenced by mortality, morbidity, or other insurance-related experience trends and the reinsurance activity related to certain blocks of
business and, as a result, can fluctuate from period to period.
Lower DAC amortization resulting from investment losses and adjustments for management’s update of assumptions used to determine
estimated gross margins contributed $113 million, net of income tax, to the increase in income from continuing operations.
Higher net investment income on blocks of business that were not driven by interest margins of $16 million, net of income tax, also
contributed to the increase in income from continuing operations.
The decrease in the closed block-related policyholder dividend obligation of $4 million, net of income tax, also contributed to the
increaseinincomefromcontinuingoperations.
These aforementioned increases in income from continuing operations were partially offset by a decline in interest margins of
$58 million, net of income tax. Interest margin relates primarily to the general account portion of investment-type products. Management
attributed $40 million of this decrease to the deferred annuity business and the remaining $18 million to other investment-type products.
Interest margin is the difference between interest earned and interest credited to PABs related to the general account on these businesses.
Interest earned approximates net investment income on invested assets attributed to these businesses with net adjustments for other non-
policyholder elements. Interest credited approximates the amount recorded in interest credited to PABs. Interest credited to PABs is
subject to contractual terms, including some minimum guarantees, and may reflect actions by management to respond to competitive
pressures. Interest credited to PABs tends to move gradually over time to reflect market interest rate movements, subject to any minimum
guarantees, and therefore, generally does not introduce volatility in expense.
In addition, the increase in income from continuing operations was partially offset by higher expenses of $52 million, net of income tax.
Higher general spending in the current period was partially offset by higher corporate incentives in the prior year.
23MetLife, Inc.