MetLife 2006 Annual Report Download - page 67
Download and view the complete annual report
Please find page 67 of the 2006 MetLife annual report below. You can navigate through the pages in the report by either clicking on the pages listed below, or by using the keyword search tool below to find specific information within the annual report.-
 1
1 -
2
-
3
-
4
-
5
-
6
-
7
-
8
-
9
-
10
-
11
-
12
-
13
-
14
-
15
-
16
-
17
-
18
-
19
-
20
-
21
-
22
-
23
-
24
-
25
-
26
-
27
-
28
-
29
-
30
-
31
-
32
-
33
-
34
-
35
-
36
-
37
-
38
-
39
-
40
-
41
-
42
-
43
-
44
-
45
-
46
-
47
-
48
-
49
-
50
-
51
-
52
-
53
-
54
-
55
-
56
-
 57
57 -
 58
58 -
 59
59 -
 60
60 -
 61
61 -
 62
62 -
 63
63 -
 64
64 -
 65
65 -
 66
66 -
 67
67 -
 68
68 -
 69
69 -
 70
70 -
 71
71 -
 72
72 -
 73
73 -
 74
74 -
 75
75 -
 76
76 -
 77
77 -
78
-
79
-
80
-
81
-
82
-
83
-
84
-
85
-
86
-
87
-
88
-
89
-
90
-
91
-
92
-
93
-
94
-
95
-
96
-
97
-
98
-
99
-
100
-
101
-
102
-
103
-
104
-
105
-
106
-
107
-
108
-
109
-
110
-
111
-
112
-
113
-
114
-
115
-
116
-
117
-
118
-
119
-
120
-
121
-
122
-
123
-
124
-
125
-
126
-
127
-
128
-
129
-
130
-
131
-
132
-
133
-
134
-
135
-
136
-
137
-
138
-
139
-
140
-
141
-
142
-
143
-
144
-
145
-
146
-
147
-
148
-
149
-
150
-
151
-
152
-
153
-
154
-
155
-
156
-
157
-
158
-
159
-
160
-
161
-
162
-
163
-
164
-
165
-
166
 |
 |

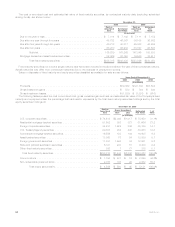
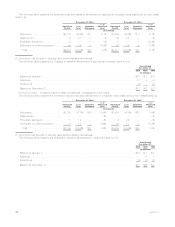
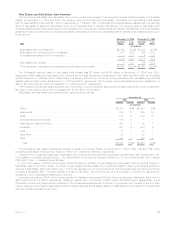
The cost or amortized cost and estimated fair value of fixed maturity securities, by contractual maturity date (excluding scheduled
sinking funds), are shown below:
Cost or
Amortized
Cost Estimated
Fair Value
Cost or
Amortized
Cost
Estimated
Fair
Value
2006 2005
December 31,
(In millions)
Dueinoneyearorless.................................... $ 7,014 $ 7,102 $ 7,111 $ 7,152
Due after one year through five years . . . . . . . . . . . . . . . . . . . . . . . . . . 45,782 46,367 36,105 36,562
Due after five years through ten years . . . . . . . . . . . . . . . . . . . . . . . . . . 40,213 40,817 45,303 46,256
Dueaftertenyears ...................................... 63,280 66,982 58,827 63,563
Subtotal . . . . . . . . . . . . . . . . . . . . . . . . . . . . . . . . . . . . . . . . 156,289 161,268 147,346 153,533
Mortgage-backed and asset-backed securities . . . . . . . . . . . . . . . . . . . . 82,026 82,160 76,580 76,517
Total fixed maturity securities . . . . . . . . . . . . . . . . . . . . . . . . . . $238,315 $243,428 $223,926 $230,050
Fixed maturity securities not due at a single maturity date have been included in the above table in the year of final contractual maturity.
Actual maturities may differ from contractual maturities due to the exercise of prepayment options.
Sales or disposals of fixed maturity and equity securities classified as available-for-sale are as follows:
2006 2005 2004
Years Ended December 31,
(In millions)
Proceeds....................................................... $89,869 $127,709 $57,604
Grossinvestmentgains ............................................. $ 580 $ 704 $ 844
Grossinvestmentlosses............................................. $(1,533) $ (1,391) $ (516)
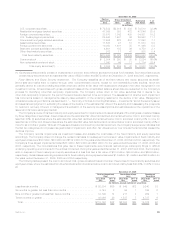
The following tables present the cost or amortized cost, gross unrealized gain and loss, and estimated fair value of the Company’s fixed
maturity and equity securities, the percentage that each sector represents by the total fixed maturity securities holdings and by the total
equity securities holdings at:
Cost or
Amortized
Cost Gain Loss Estimated
Fair Value %of
Total
Gross Unrealized
December 31, 2006
(In millions)
U.S.corporatesecurities................................ $ 74,618 $2,049 $1,017 $ 75,650 31.1%
Residential mortgage-backed securities . . . . . . . . . . . . . . . . . . . . . . 51,602 385 321 51,666 21.2
Foreigncorporatesecurities.............................. 34,231 1,924 386 35,769 14.7
U.S.Treasury/agencysecurities ........................... 29,897 984 248 30,633 12.6
Commercialmortgage-backedsecurities...................... 16,556 193 144 16,605 6.8
Asset-backedsecurities ................................ 13,868 75 54 13,889 5.7
Foreigngovernmentsecurities ............................ 11,037 1,598 34 12,601 5.2
Stateandpoliticalsubdivisionsecurities...................... 6,121 230 51 6,300 2.6
Otherfixedmaturitysecurities............................. 385 7 77 315 0.1
Total fixed maturity securities . . . . . . . . . . . . . . . . . . . . . . . . . . . . $238,315 $7,445 $2,332 $243,428 100.0%
Commonstock ...................................... $ 1,798 $ 487 $ 16 $ 2,269 44.2%
Non-redeemablepreferredstock........................... 2,788 103 29 2,862 55.8
Total equity securities(1) . . . . . . . . . . . . . . . . . . . . . . . . . . . $ 4,586 $ 590 $ 45 $ 5,131 100.0%
64 MetLife, Inc.