MetLife 2006 Annual Report Download - page 73
Download and view the complete annual report
Please find page 73 of the 2006 MetLife annual report below. You can navigate through the pages in the report by either clicking on the pages listed below, or by using the keyword search tool below to find specific information within the annual report.-
 1
1 -
2
-
3
-
4
-
5
-
6
-
7
-
8
-
9
-
10
-
11
-
12
-
13
-
14
-
15
-
16
-
17
-
18
-
19
-
20
-
21
-
22
-
23
-
24
-
25
-
26
-
27
-
28
-
29
-
30
-
31
-
32
-
33
-
34
-
35
-
36
-
37
-
38
-
39
-
40
-
41
-
42
-
43
-
44
-
45
-
46
-
47
-
48
-
49
-
50
-
51
-
52
-
53
-
54
-
55
-
56
-
57
-
58
-
59
-
60
-
61
-
62
-
 63
63 -
 64
64 -
 65
65 -
 66
66 -
 67
67 -
 68
68 -
 69
69 -
 70
70 -
 71
71 -
 72
72 -
 73
73 -
 74
74 -
 75
75 -
 76
76 -
 77
77 -
 78
78 -
 79
79 -
 80
80 -
 81
81 -
 82
82 -
 83
83 -
84
-
85
-
86
-
87
-
88
-
89
-
90
-
91
-
92
-
93
-
94
-
95
-
96
-
97
-
98
-
99
-
100
-
101
-
102
-
103
-
104
-
105
-
106
-
107
-
108
-
109
-
110
-
111
-
112
-
113
-
114
-
115
-
116
-
117
-
118
-
119
-
120
-
121
-
122
-
123
-
124
-
125
-
126
-
127
-
128
-
129
-
130
-
131
-
132
-
133
-
134
-
135
-
136
-
137
-
138
-
139
-
140
-
141
-
142
-
143
-
144
-
145
-
146
-
147
-
148
-
149
-
150
-
151
-
152
-
153
-
154
-
155
-
156
-
157
-
158
-
159
-
160
-
161
-
162
-
163
-
164
-
165
-
166
 |
 |

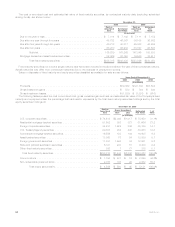
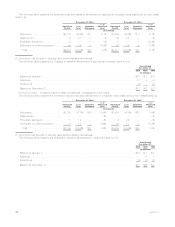
The following table presents the amortized cost and valuation allowances for agricultural mortgage loans distributed by loan classi-
fication at:
Amortized
Cost(1) %of
Total Valuation
Allowance
%of
Amortized
Cost Amortized
Cost(1) %of
Total Valuation
Allowance
%of
Amortized
Cost
December 31, 2006 December 31, 2005
(In millions)
Performing.................. $9,172 99.4% $11 0.1% $7,635 99.0% $ 8 0.1%
Restructured................. 9 0.1 — —% 36 0.5 — —%
Potentiallydelinquent........... 2 — — —% 3 — 1 33.3%
Delinquent or under foreclosure . . . . 48 0.5 7 14.6% 37 0.5 2 5.4%
Total . . . . . . . . . . . . . . . . . . . . $9,231 100.0% $18 0.2% $7,711 100.0% $11 0.1%
(1) Amortized cost is equal to carrying value before valuation allowances.
The following table presents the changes in valuation allowances for agricultural mortgage loans for the:
2006 2005 2004
Years Ended
December 31,
(In millions)
BalanceatJanuary1,........................................................ $11 $ 7 $6
Additions ................................................................ 10 4 5
Deductions............................................................... (3) — (4)
BalanceatDecember31,...................................................... $18 $11 $7
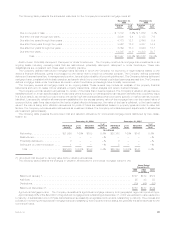
Consumer Loans. Consumer loans consist of residential mortgages and auto loans.
The following table presents the amortized cost and valuation allowances for consumer loans distributed by loan classification at:
Amortized
Cost(1) %of
Total Valuation
Allowance
%of
Amortized
Cost Amortized
Cost(1) %of
Total Valuation
Allowance
%of
Amortized
Cost
December 31, 2006 December 31, 2005
(In millions)
Performing.................. $1,155 97.1% $10 0.9% $1,454 98.1% $13 0.9%
Restructured................. — — — —% — — — —%
Potentiallydelinquent........... 17 1.4 — —% 9 0.6 — —%
Delinquent or under foreclosure . . . . 18 1.5 1 5.6% 20 1.3 2 10.0%
Total . . . . . . . . . . . . . . . . . . . . $1,190 100.0% $11 0.9% $1,483 100.0% $15 1.0%
(1) Amortized cost is equal to carrying value before valuation allowances.
The following table presents the changes in valuation allowances for consumer loans for the:
2006 2005 2004
Years Ended
December 31,
(In millions)
BalanceatJanuary1,........................................................ $15 $ 1 $1
Additions ................................................................ — 17 1
Deductions............................................................... (4) (3) (1)
BalanceatDecember31,...................................................... $11 $15 $1
70 MetLife, Inc.