MetLife 2006 Annual Report Download - page 70
Download and view the complete annual report
Please find page 70 of the 2006 MetLife annual report below. You can navigate through the pages in the report by either clicking on the pages listed below, or by using the keyword search tool below to find specific information within the annual report.-
 1
1 -
2
-
3
-
4
-
5
-
6
-
7
-
8
-
9
-
10
-
11
-
12
-
13
-
14
-
15
-
16
-
17
-
18
-
19
-
20
-
21
-
22
-
23
-
24
-
25
-
26
-
27
-
28
-
29
-
30
-
31
-
32
-
33
-
34
-
35
-
36
-
37
-
38
-
39
-
40
-
41
-
42
-
43
-
44
-
45
-
46
-
47
-
48
-
49
-
50
-
51
-
52
-
53
-
54
-
55
-
56
-
57
-
58
-
59
-
 60
60 -
 61
61 -
 62
62 -
 63
63 -
 64
64 -
 65
65 -
 66
66 -
 67
67 -
 68
68 -
 69
69 -
 70
70 -
 71
71 -
 72
72 -
 73
73 -
 74
74 -
 75
75 -
 76
76 -
 77
77 -
 78
78 -
 79
79 -
 80
80 -
81
-
82
-
83
-
84
-
85
-
86
-
87
-
88
-
89
-
90
-
91
-
92
-
93
-
94
-
95
-
96
-
97
-
98
-
99
-
100
-
101
-
102
-
103
-
104
-
105
-
106
-
107
-
108
-
109
-
110
-
111
-
112
-
113
-
114
-
115
-
116
-
117
-
118
-
119
-
120
-
121
-
122
-
123
-
124
-
125
-
126
-
127
-
128
-
129
-
130
-
131
-
132
-
133
-
134
-
135
-
136
-
137
-
138
-
139
-
140
-
141
-
142
-
143
-
144
-
145
-
146
-
147
-
148
-
149
-
150
-
151
-
152
-
153
-
154
-
155
-
156
-
157
-
158
-
159
-
160
-
161
-
162
-
163
-
164
-
165
-
166
 |
 |

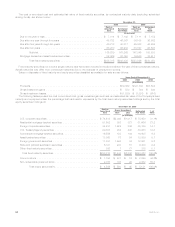
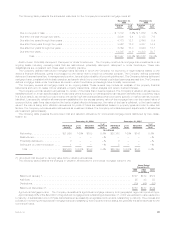
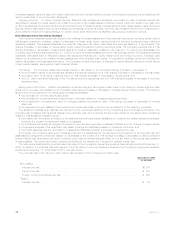
Corporate Fixed Maturity Securities. The table below shows the major industry types that comprise the corporate fixed maturity
holdings at:
Estimated
Fair Value %of
Total Estimated
Fair Value %of
Total
December 31, 2006 December 31, 2005
(In millions)
Industrial.................................................. $ 39,535 35.5% $ 41,332 37.7%
Foreign(1)................................................. 35,769 32.1 34,981 31.9
Finance................................................... 21,746 19.5 19,222 17.6
Utility .................................................... 13,105 11.8 12,633 11.6
Other.................................................... 1,264 1.1 1,323 1.2
Total . . . . . . . . . . . . . . . . . . . . . . . . . . . . . . . . . . . . . . . . . . . . . . . $111,419 100.0% $109,491 100.0%
(1) Includes U.S. dollar-denominated debt obligations of foreign obligors and other foreign investments.
The Company maintains a diversified corporate fixed maturity portfolio across industries and issuers. The portfolio does not have
exposure to any single issuer in excess of 1% of the total invested assets of the portfolio. At December 31, 2006 and 2005, the Company’s
combined holdings in the ten issuers to which it had the greatest exposure totaled $6.8 billion and $6.2 billion, respectively, each less than
3% of the Company’s total invested assets at such dates. The exposure to the largest single issuer of corporate fixed maturity securities
held at December 31, 2006 and 2005 was $970 million and $943 million, respectively.
The Company has hedged all of its material exposure to foreign currency risk in its corporate fixed maturity portfolio. In the Company’s
international insurance operations, both its assets and liabilities are generally denominated in local currencies.
Structured Securities. The following table shows the types of structured securities the Company held at:
Estimated
Fair Value %of
Total Estimated
Fair Value %of
Total
December 31, 2006 December 31, 2005
(In millions)
Residential mortgage-backed securities:
Collateralizedmortgageobligations ................................... $33,034 40.2% $29,679 38.8%
Pass-throughsecurities........................................... 18,632 22.7 17,567 23.0
Totalresidentialmortgage-backedsecurities............................... 51,666 62.9 47,246 61.8
Commercialmortgage-backedsecurities ................................. 16,605 20.2 17,698 23.1
Asset-backedsecurities............................................ 13,889 16.9 11,573 15.1
Total . . . . . . . . . . . . . . . . . . . . . . . . . . . . . . . . . . . . . . . . . . . . . . . . . . . . . . $82,160 100.0% $76,517 100.0%
The majority of the residential mortgage-backed securities are guaranteed or otherwise supported by the Federal National Mortgage
Association, the Federal Home Loan Mortgage Corporation or the Government National Mortgage Association. At December 31, 2006 and
2005, $51.0 billion and $46.3 billion, respectively, or 99% and 98%, respectively, of the residential mortgage-backed securities were rated
Aaa/AAA by Moody’s, S&P or Fitch.
At December 31, 2006 and 2005, $13.8 billion and $13.3 billion, respectively, or 83% and 75%, respectively, of the commercial
mortgage-backed securities were rated Aaa/AAA by Moody’s, S&P or Fitch.
The Company’s asset-backed securities are diversified both by sector and by issuer. Credit card receivables and home equity loans,
accounting for about 35% and 22% of the total holdings, respectively, constitute the largest exposures in the Company’s asset-backed
securities portfolio. At December 31, 2006 and 2005, $8.0 billion and $6.1 billion, respectively, or 57% and 53%, respectively, of total
asset-backed securities were rated Aaa/AAA by Moody’s, S&P or Fitch.
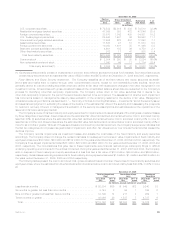
Structured Investment Transactions. The Company participates in structured investment transactions which enhance the Company’s
total return on its investment portfolio principally by providing equity-based returns on debt securities through structured notes and similar
instruments. The carrying value of such investments, included in fixed maturity securities, was $354 million and $362 million at
December 31, 2006 and 2005, respectively. The related net investment income recognized was $43 million, $28 million and $45 million
for the years ended December 31, 2006, 2005 and 2004, respectively.
Trading Securities
During 2005, the Company established a trading securities portfolio to support investment strategies that involve the active and
frequent purchase and sale of securities, the execution of short sale agreements and asset and liability matching strategies for certain
insurance products. Trading securities and short sale agreement liabilities are recorded at fair value with subsequent changes in fair value
recognized in net investment income related to fixed maturity securities.
At December 31, 2006 and 2005, trading securities were $759 million and $825 million, respectively, and liabilities associated with the
short sale agreements in the trading securities portfolio, which were included in other liabilities, were $387 million and $460 million,
respectively. The Company had pledged $614 million and $375 million of its assets, primarily consisting of trading securities, as collateral
to secure the liabilities associated with the short sale agreements in the trading securities portfolio for the years ended December 31, 2006
and 2005, respectively.
As part of the acquisition of Travelers on July 1, 2005, the Company acquired Travelers’ investment in Tribeca Citigroup Investments
Ltd. (“Tribeca”). Tribeca was a feeder fund investment structure whereby the feeder fund invests substantially all of its assets in the master
fund, Tribeca Global Convertible Instruments Ltd. The primary investment objective of the master fund is to achieve enhanced risk-adjusted
67MetLife, Inc.