MetLife 2006 Annual Report Download - page 56
Download and view the complete annual report
Please find page 56 of the 2006 MetLife annual report below. You can navigate through the pages in the report by either clicking on the pages listed below, or by using the keyword search tool below to find specific information within the annual report.-
 1
1 -
2
-
3
-
4
-
5
-
6
-
7
-
8
-
9
-
10
-
11
-
12
-
13
-
14
-
15
-
16
-
17
-
18
-
19
-
20
-
21
-
22
-
23
-
24
-
25
-
26
-
27
-
28
-
29
-
30
-
31
-
32
-
33
-
34
-
35
-
36
-
37
-
38
-
39
-
40
-
41
-
42
-
43
-
44
-
45
-
 46
46 -
 47
47 -
 48
48 -
 49
49 -
 50
50 -
 51
51 -
 52
52 -
 53
53 -
 54
54 -
 55
55 -
 56
56 -
 57
57 -
 58
58 -
 59
59 -
 60
60 -
 61
61 -
 62
62 -
 63
63 -
 64
64 -
 65
65 -
 66
66 -
67
-
68
-
69
-
70
-
71
-
72
-
73
-
74
-
75
-
76
-
77
-
78
-
79
-
80
-
81
-
82
-
83
-
84
-
85
-
86
-
87
-
88
-
89
-
90
-
91
-
92
-
93
-
94
-
95
-
96
-
97
-
98
-
99
-
100
-
101
-
102
-
103
-
104
-
105
-
106
-
107
-
108
-
109
-
110
-
111
-
112
-
113
-
114
-
115
-
116
-
117
-
118
-
119
-
120
-
121
-
122
-
123
-
124
-
125
-
126
-
127
-
128
-
129
-
130
-
131
-
132
-
133
-
134
-
135
-
136
-
137
-
138
-
139
-
140
-
141
-
142
-
143
-
144
-
145
-
146
-
147
-
148
-
149
-
150
-
151
-
152
-
153
-
154
-
155
-
156
-
157
-
158
-
159
-
160
-
161
-
162
-
163
-
164
-
165
-
166
 |
 |

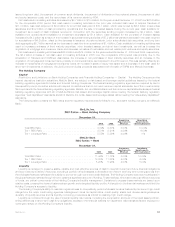
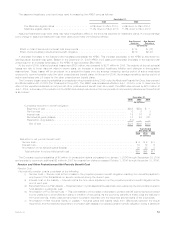
The assumed healthcare cost trend rates used in measuring the APBO were as follows:
2006 2005
December 31,
Pre-Medicare eligible claims . . . . . . . . . . . . . . . . . . . . 9.0% down to 5% in 2014 9.5% down to 5% in 2014
Medicare eligible claims . . . . . . . . . . . . . . . . . . . . . . . 11.0% down to 5% in 2018 11.5% down to 5% in 2018
Assumed healthcare cost trend rates may have a significant effect on the amounts reported for healthcare plans. A one-percentage
point change in assumed healthcare cost trend rates would have the following effects:
One Percent
Increase One Percent
Decrease
(In millions)
Effectontotalofserviceandinterestcostcomponents .............................. $ 14 $ (12)
Effect of accumulated postretirement benefit obligation . . . . . . . . . . . . . . . . . . . . . . . . . . . . . . $176 $(147)
A decrease (increase) in the discount rate increases (decreases) the APBO. This increase (decrease) to the APBO is amortized into
earnings as an actuarial loss (gain). Based on the December 31, 2006 APBO, a 25 basis point decrease (increase) in the discount rate
would result in an increase (decrease) in the APBO of approximately $60 million.
At the end of 2006, total net actuarial losses were $328 million, as compared to $377 million in 2005. The majority of the net actuarial
losses are due to lower discount rates in recent years, an increase in expected healthcare inflation and changes in demographic
assumptions. These losses will be amortized on a straight-line basis over the average remaining service period of active employees
expected to receive benefits under the other postretirement benefit plans. At the end of 2006, the average remaining service period of
active employees was 9.6 years for the other postretirement benefit plans.
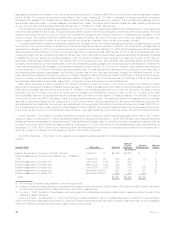
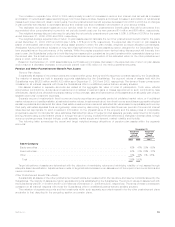
The Company began receiving subsidies on prescription drug benefits during 2006 under the Medicare Prescription Drug, Improvement
and Modernization Act of 2003 (the “Prescription Drug Act”). The APBO was remeasured effective July 1, 2004 in order to determine the
effect of the expected subsidies on net periodic other postretirement benefit cost. As a result, the APBO was reduced by $213 million at
July 1, 2004. A summary of the reduction to the APBO and related reductions in the components of net periodic postretirement benefit cost
is as follows:
2006 2005 2004
December 31,
(In millions)
Cumulative reduction in benefit obligation:
Beginningofyear.................................................. $298 $230 $ —
Servicecost..................................................... 6 6 3
Interestcost..................................................... 19 16 6
Netactuarialgains(losses) ........................................... 15 46 221
Prescriptiondrugsubsidy............................................. (10) — —
Endofyear .................................................... $328 $298 $230
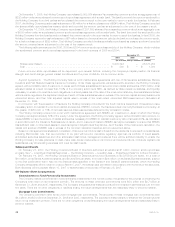
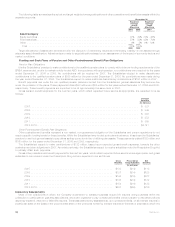
2006 2005 2004
Years Ended
December 31,
(In millions)
Reduction in net periodic benefit cost:
Servicecost............................................................. $ 6 $ 6 $ 3
Interestcost............................................................. 19 16 6
Amortizationofnetactuarialgains(losses) ......................................... 30 23 8
Totalreductioninnetperiodicbenefitcost........................................ $55 $45 $17
The Company received subsidies of $8 million for prescription claims processed from January 1, 2006 through September 30, 2006
and expects to receive an additional $2 million in 2007 for prescription claims processed October 1, 2006 through December 31, 2006.
Pension and Other Postretirement Net Periodic Benefit Cost
Pension Cost
Net periodic pension cost is comprised of the following:
i) Service Cost — Service cost is the increase in the projected pension benefit obligation resulting from benefits payable to
employees of the Subsidiaries on service rendered during the current year.
ii) Interest Cost on the Liability — Interest cost is the time value adjustment on the projected pension benefit obligation at the
end of each year.
iii) Expected Return on Plan Assets — Expected return on plan assets is the assumed return earned by the accumulated pension
fund assets in a particular year.
iv) Amortization of Prior Service Cost — This cost relates to the increase or decrease to pension benefit cost for service provided
in prior years due to amendments in plans or initiation of new plans. As the economic benefits of these costs are realized in
the future periods, these costs are amortized to pension expense over the expected service years of the employees.
v) Amortization of Net Actuarial Gains or Losses — Actuarial gains and losses result from differences between the actual
experience and the expected experience on pension plan assets or projected pension benefit obligation during a particular
53MetLife, Inc.