MetLife 2006 Annual Report Download - page 116
Download and view the complete annual report
Please find page 116 of the 2006 MetLife annual report below. You can navigate through the pages in the report by either clicking on the pages listed below, or by using the keyword search tool below to find specific information within the annual report.-
 1
1 -
2
-
3
-
4
-
5
-
6
-
7
-
8
-
9
-
10
-
11
-
12
-
13
-
14
-
15
-
16
-
17
-
18
-
19
-
20
-
21
-
22
-
23
-
24
-
25
-
26
-
27
-
28
-
29
-
30
-
31
-
32
-
33
-
34
-
35
-
36
-
37
-
38
-
39
-
40
-
41
-
42
-
43
-
44
-
45
-
46
-
47
-
48
-
49
-
50
-
51
-
52
-
53
-
54
-
55
-
56
-
57
-
58
-
59
-
60
-
61
-
62
-
63
-
64
-
65
-
66
-
67
-
68
-
69
-
70
-
71
-
72
-
73
-
74
-
75
-
76
-
77
-
78
-
79
-
80
-
81
-
82
-
83
-
84
-
85
-
86
-
87
-
88
-
89
-
90
-
91
-
92
-
93
-
94
-
95
-
96
-
97
-
98
-
99
-
100
-
101
-
102
-
103
-
104
-
105
-
 106
106 -
 107
107 -
 108
108 -
 109
109 -
 110
110 -
 111
111 -
 112
112 -
 113
113 -
 114
114 -
 115
115 -
 116
116 -
 117
117 -
 118
118 -
 119
119 -
 120
120 -
 121
121 -
 122
122 -
 123
123 -
 124
124 -
 125
125 -
 126
126 -
127
-
128
-
129
-
130
-
131
-
132
-
133
-
134
-
135
-
136
-
137
-
138
-
139
-
140
-
141
-
142
-
143
-
144
-
145
-
146
-
147
-
148
-
149
-
150
-
151
-
152
-
153
-
154
-
155
-
156
-
157
-
158
-
159
-
160
-
161
-
162
-
163
-
164
-
165
-
166
 |
 |

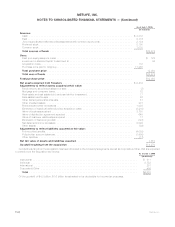
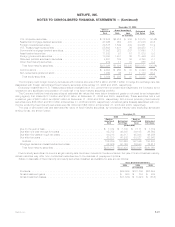
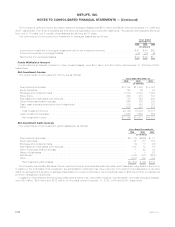
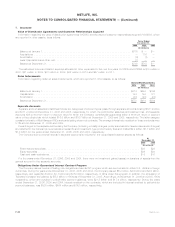
Net Unrealized Investment Gains (Losses)
The components of net unrealized investment gains (losses), included in accumulated other comprehensive income, are as follows:
2006 2005 2004
Years Ended December 31,
(In millions)
Fixedmaturitysecurities ............................................... $5,075 $6,132 $9,602
Equitysecurities .................................................... 541 247 287
Derivatives........................................................ (208) (142) (503)
Minorityinterest..................................................... (159) (171) (104)
Other ........................................................... 9 (102) 39
Subtotal........................................................ 5,258 5,964 9,321
Amounts allocated from:
Futurepolicybenefitlossrecognition ..................................... (1,149) (1,410) (1,991)
DACandVOBA ................................................... (189) (79) (541)
Policyholderdividendobligation......................................... (1,062) (1,492) (2,119)
Subtotal....................................................... (2,400) (2,981) (4,651)
Deferredincometax.................................................. (994) (1,041) (1,676)
Subtotal........................................................ (3,394) (4,022) (6,327)
Netunrealizedinvestmentgains(losses)..................................... $1,864 $1,942 $2,994
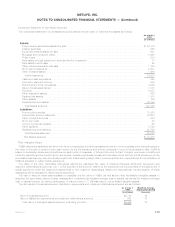
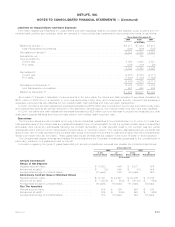
The changes in net unrealized investment gains (losses) are as follows:
2006 2005 2004
Years Ended December 31,
(In millions)
Balance,January1,................................................... $1,942 $2,994 $2,972
Unrealizedinvestmentgains(losses)duringtheyear.............................. (706) (3,372) 201
Unrealizedinvestmentgainsofsubsidiariesatthedateofsale ....................... — 15 —
Unrealized investment gains (losses) relating to:
Futurepolicybenefitgain(loss)recognition .................................. 261 581 (509)
DACandVOBA .................................................... (110) 462 133
Participatingcontracts................................................ — — 183
Policyholderdividendobligation.......................................... 430 627 11
Deferredincometax ................................................. 47 635 3
Balance,December31, ................................................ $1,864 $1,942 $2,994
Netchangeinunrealizedinvestmentgains(losses)............................... $ (78) $(1,052) $ 22
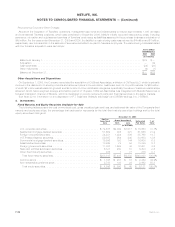
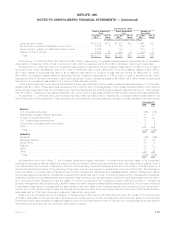
Trading Securities
During 2005, the Company established a trading securities portfolio to support investment strategies that involve the active and
frequent purchase and sale of securities, the execution of short sale agreements and asset and liability matching strategies for certain
insurance products. Trading securities and short sale agreement liabilities are recorded at fair value with subsequent changes in fair value
recognized in net investment income related to fixed maturity securities.
At December 31, 2006 and 2005, trading securities were $759 million and $825 million, respectively, and liabilities associated with the
short sale agreements in the trading securities portfolio, which were included in other liabilities, were $387 million and $460 million,
respectively. The Company had pledged $614 million and $375 million of its assets, primarily consisting of trading securities, as collateral
to secure the liabilities associated with the short sale agreements in the trading securities portfolio for the years ended December 31, 2006
and 2005, respectively.
As part of the acquisition of Travelers on July 1, 2005, the Company acquired Travelers’ investment in Tribeca Citigroup Investments
Ltd. (“Tribeca”). Tribeca was a feeder fund investment structure whereby the feeder fund invests substantially all of its assets in the master
fund, Tribeca Global Convertible Instruments Ltd. The primary investment objective of the master fund is to achieve enhanced risk-adjusted
return by investing in domestic and foreign equities and equity-related securities utilizing such strategies as convertible securities arbitrage.
At December 31, 2005, MetLife was the majority owner of the feeder fund and consolidated the fund within its consolidated financial
statements. At December 31, 2005, $452 million of trading securities and $190 million of the short sale agreements were related to
Tribeca. Net investment income related to the trading activities of Tribeca, which included interest and dividends earned and net realized
and unrealized gains (losses), was $12 million and $6 million for the six months ended June 30, 2006 and the year ended December 31,
2005.
During the second quarter of 2006, MetLife’s ownership interests in Tribeca declined to a position whereby Tribeca is no longer
consolidated and, as of June 30, 2006, was accounted for under the equity method of accounting. The equity method investment at
December 31, 2006 of $82 million was included in other limited partnership interests. Net investment income related to the Company’s
equity method investment in Tribeca was $9 million for the six months ended December 31, 2006.
F-33MetLife, Inc.
METLIFE, INC.
NOTES TO CONSOLIDATED FINANCIAL STATEMENTS — (Continued)