MetLife 2006 Annual Report Download - page 57
Download and view the complete annual report
Please find page 57 of the 2006 MetLife annual report below. You can navigate through the pages in the report by either clicking on the pages listed below, or by using the keyword search tool below to find specific information within the annual report.
period. These gains and losses are accumulated and, to the extent they exceed 10% of the greater of the projected pension
benefit obligation or the market-related value of plan assets, they are amortized into pension expense over the expected
service years of the employees.
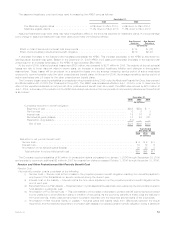
The Subsidiaries recognized pension expense of $180 million in 2006 as compared to $146 million in 2005 and $129 million in 2004.
The major components of net periodic pension cost described above were as follows:
2006 2005 2004
Years Ended December 31,
(In millions)
Servicecost........................................................... $163 $142 $129
Interestcost........................................................... 335 318 311
Expectedreturnonplanassets .............................................. (454) (446) (428)
Amortizationofnetactuarial(gains)losses ....................................... 125 116 101
Amortizationofpriorservicecost(credit) ........................................ 11 16 16
Netperiodicbenefitcost ................................................. $180 $146 $129
The increase in expense was primarily a result of both increases in service and interest cost and amortization of net actuarial losses
resulting largely from lower discount rates, partially offset by the impact of an increase in the expected return on plan assets due to a larger
plan assets base.
The estimated net actuarial losses and prior service cost for the defined benefit pension plans that will be amortized from accumulated
other comprehensive income into net periodic benefit cost over the next year are $54 million and $12 million, respectively.
The weighted average discount rate used to calculate the net periodic pension cost was 5.82%, 5.83% and 6.10% for the years ended
December 31, 2006, 2005 and 2004, respectively.
The weighted average expected rate of return on pension plan assets used to calculate the net periodic pension cost for the years
ended December 31, 2006, 2005 and 2004 was 8.25%, 8.50% and 8.50%, respectively. The expected rate of return on plan assets is
based on anticipated performance of the various asset sectors in which the plan invests, weighted by target allocation percentages.
Anticipated future performance is based on long-term historical returns of the plan assets by sector, adjusted for the Subsidiaries’ long-
term expectations on the performance of the markets. While the precise expected return derived using this approach will fluctuate from
year to year, the Subsidiaries’ policy is to hold this long-term assumption constant as long as it remains within reasonable tolerance from
the derived rate. The actual net return on the investments has been an approximation of the estimated return for the pension plan in 2006,
2005 and 2004.
Based on the December 31, 2006 asset balances, a 25 basis point increase (decrease) in the expected rate of return on plan assets
would result in a decrease (increase) in net periodic benefit cost of $15 million for the pension plans.
Other Postretirement Benefit Cost
The net periodic other postretirement benefit cost consists of the following:
i) Service Cost — Service cost is the increase in the expected postretirement plan benefit obligation resulting from benefits
payable to employees of the Subsidiaries on service rendered during the current year.
ii) Interest Cost on the Liability — Interest cost is the time value adjustment on the expected postretirement benefit obligation at
the end of each year.
iii) Expected Return on Plan Assets — Expected return on plan assets is the assumed return earned by the accumulated other
postretirement fund assets in a particular year.
iv) Amortization of Prior Service Cost — This cost relates to the increase or decrease to other postretirement benefit cost for
serviceprovidedinprioryearsduetoamendmentsinplansorinitiationofnewplans.Astheeconomicbenefitsofthesecosts
are realized in the future periods these costs are amortized to other postretirement benefit expense over the expected service
years of the employees.
v) Amortization of Net Actuarial Gains or Losses — Actuarial gains and losses result from differences between the actual
experience and the expected experience on other postretirement benefit plan assets or expected postretirement plan benefit
obligation during a particular year. These gains and losses are accumulated and, to the extent they exceed 10% of the greater
of the accumulated postretirement plan benefit obligation or the market-related value of plan assets, they are amortized into
other postretirement benefit expense over the expected service years of the employees.
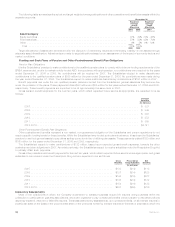
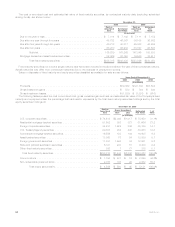
The Subsidiaries recognized other postretirement benefit expense of $60 million in 2006 as compared to $77 million in 2005 and
$62 million in 2004. The major components of net periodic other postretirement benefit cost described above were as follows:
2006 2005 2004
Years Ended
December 31,
(In millions)
Servicecost............................................................ $ 35 $ 37 $ 32
Interestcost............................................................ 117 121 119
Expectedreturnonplanassets................................................ (79) (79) (77)
Amortizationofnetactuarial(gains)losses......................................... 23 15 7
Amortizationofpriorservicecost(credit).......................................... (36) (17) (19)
Netperiodicbenefitcost................................................... $ 60 $ 77 $ 62
54 MetLife, Inc.


