MetLife 2006 Annual Report Download - page 31
Download and view the complete annual report
Please find page 31 of the 2006 MetLife annual report below. You can navigate through the pages in the report by either clicking on the pages listed below, or by using the keyword search tool below to find specific information within the annual report.-
 1
1 -
2
-
3
-
4
-
5
-
6
-
7
-
8
-
9
-
10
-
11
-
12
-
13
-
14
-
15
-
16
-
17
-
18
-
19
-
20
-
 21
21 -
 22
22 -
 23
23 -
 24
24 -
 25
25 -
 26
26 -
 27
27 -
 28
28 -
 29
29 -
 30
30 -
 31
31 -
 32
32 -
 33
33 -
 34
34 -
 35
35 -
 36
36 -
 37
37 -
 38
38 -
 39
39 -
 40
40 -
 41
41 -
42
-
43
-
44
-
45
-
46
-
47
-
48
-
49
-
50
-
51
-
52
-
53
-
54
-
55
-
56
-
57
-
58
-
59
-
60
-
61
-
62
-
63
-
64
-
65
-
66
-
67
-
68
-
69
-
70
-
71
-
72
-
73
-
74
-
75
-
76
-
77
-
78
-
79
-
80
-
81
-
82
-
83
-
84
-
85
-
86
-
87
-
88
-
89
-
90
-
91
-
92
-
93
-
94
-
95
-
96
-
97
-
98
-
99
-
100
-
101
-
102
-
103
-
104
-
105
-
106
-
107
-
108
-
109
-
110
-
111
-
112
-
113
-
114
-
115
-
116
-
117
-
118
-
119
-
120
-
121
-
122
-
123
-
124
-
125
-
126
-
127
-
128
-
129
-
130
-
131
-
132
-
133
-
134
-
135
-
136
-
137
-
138
-
139
-
140
-
141
-
142
-
143
-
144
-
145
-
146
-
147
-
148
-
149
-
150
-
151
-
152
-
153
-
154
-
155
-
156
-
157
-
158
-
159
-
160
-
161
-
162
-
163
-
164
-
165
-
166
 |
 |

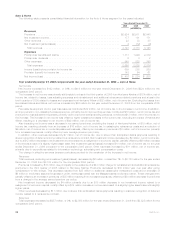
International
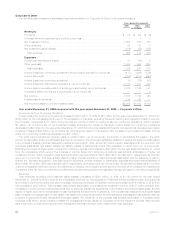
The following table presents consolidated financial information for the International segment for the years indicated:
2006 2005 2004
Years Ended December 31,
(In millions)
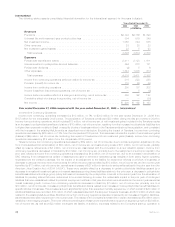
Revenues
Premiums.................................................... $2,722 $2,186 $1,690
Universallifeandinvestment-typeproductpolicyfees ....................... 804 579 349
Netinvestmentincome............................................ 1,050 844 585
Otherrevenues ................................................ 28 20 23
Netinvestmentgains(losses) ....................................... 22 5 23
Totalrevenues................................................ 4,626 3,634 2,670
Expenses
Policyholderbenefitsandclaims ..................................... 2,411 2,128 1,611
Interestcreditedtopolicyholderaccountbalances.......................... 364 278 151
Policyholderdividends............................................ (2) 5 6
Otherexpenses ................................................ 1,543 1,000 614
Totalexpenses ............................................... 4,316 3,411 2,382
Incomefromcontinuingoperationsbeforeprovisionforincometax............... 310 223 288
Provision(benefit)forincometax ..................................... 110 36 86
Incomefromcontinuingoperations.................................... 200 187 202
Income(loss)fromdiscontinuedoperations,netofincometax.................. — 5 (9)
Income before cumulative effect of a change in accounting, net of income tax . . . . . . . . 200 192 193
Cumulativeeffectofachangeinaccounting,netofincometax ................. — — (30)
Netincome................................................... $ 200 $ 192 $ 163
Year ended December 31, 2006 compared with the year ended December 31, 2005 — International
Income from Continuing Operations
Income from continuing operations increased by $13 million, or 7%, to $200 million for the year ended December 31, 2006 from
$187 million for the comparable 2005 period. The acquisition of Travelers contributed $38 million during the first six months of 2006 to
income from continuing operations, which includes $18 million, net of income tax, of net investment gains. Included in the Travelers results
is an increase to policyholder benefits and claims of $10 million, net of income tax, resulting from the increase in policyholder liabilities due
to higher than expected mortality in Brazil on specific blocks of business written in the Travelers entity since the acquisition, and consistent
with the increase in the existing MetLife entity as described more fully below. Excluding the impact of Travelers, income from continuing
operations decreased by $25 million, or 13%, from the comparable 2005 period. This decrease includes the impact of net investment gains
(losses) of ($6) million, net of income tax. Excluding the impact of Travelers and of net investment gains (losses), income from continuing
operations decreased by $19 million from the comparable 2005 period.
Taiwan’s income from continuing operations decreased by $59 million, net of income tax, due to a loss recognition adjustment (in the
form of accelerated DAC amortization) of $50 million, net of income tax, and restructuring costs of $11 million, net of income tax, partially
offset by reserve refinements of $3 million, net of income tax, associated with the conversion to a new valuation system. Income from
continuing operations decreased in Canada by $19 million, net of income tax, primarily due to the realignment of economic capital in the
prior year. Mexico’s income from continuing operations decreased by $12 million, net of income tax, due to an increase in amortization of
DAC resulting from management’s update of assumptions used to determine estimated gross margins in both years, higher operating
expenses from the pension business, the net impact of an adjustment to the liability for experience refunds on a block of business, a
decrease in various one-time other revenue items for which the prior year benefited by $13 million, net of income tax, and the current year
benefited by $11 million, net of income tax, as well as an increase of $27 million in tax due to tax benefits realized in the prior year from the
American Jobs Creation Act of 2004 (“AJCA”). These were partially offset by a decrease in certain policyholder liabilities caused by a
decrease in unrealized investment gains on invested assets supporting those liabilities relative to the prior year, a decrease in policyholder
benefits associated with a large group policy that was not renewed by the policyholder, a benefit in the current year from the elimination of
liabilities for pending claims that were determined to be invalid following a review, the unfavorable impact in the prior year of contingent
liabilities that were established related to potential employment matters in that year and which were eliminated in the current year as well as
overall business growth. Income from continuing operations decreased in Brazil by $7 million, net of income tax, primarily due to a
$10 million, net of income tax, increase in policyholder benefits and claims related to an increase in future policyholder benefit liabilities on
specific blocks of business. This increase is due to significantly higher than expected mortality experience, of which a total of $20 million of
additional liabilities were recorded, $10 million of which was associated with the acquired Travelers’ business, and $10 million of which was
related to the existing MetLife entities. Brazil’s income from continuing operations was also impacted by an increase in litigation liabilities,
as well as adverse claim experience in the current year. The results of the Company’s investment in Japan decreased by $4 million due to
variability in the hedging program. The home office recorded higher infrastructure expenditures in support of segment growth of $39 million,
net of income tax, as well as a $23 million contingent tax liability. In addition, expenses related to the Company’s start-up operation in
28 MetLife, Inc.