MetLife 2006 Annual Report Download - page 7
Download and view the complete annual report
Please find page 7 of the 2006 MetLife annual report below. You can navigate through the pages in the report by either clicking on the pages listed below, or by using the keyword search tool below to find specific information within the annual report.-
 1
1 -
 2
2 -
 3
3 -
 4
4 -
 5
5 -
 6
6 -
 7
7 -
 8
8 -
 9
9 -
 10
10 -
 11
11 -
 12
12 -
 13
13 -
 14
14 -
 15
15 -
 16
16 -
 17
17 -
 18
18 -
19
-
20
-
21
-
22
-
23
-
24
-
25
-
26
-
27
-
28
-
29
-
30
-
31
-
32
-
33
-
34
-
35
-
36
-
37
-
38
-
39
-
40
-
41
-
42
-
43
-
44
-
45
-
46
-
47
-
48
-
49
-
50
-
51
-
52
-
53
-
54
-
55
-
56
-
57
-
58
-
59
-
60
-
61
-
62
-
63
-
64
-
65
-
66
-
67
-
68
-
69
-
70
-
71
-
72
-
73
-
74
-
75
-
76
-
77
-
78
-
79
-
80
-
81
-
82
-
83
-
84
-
85
-
86
-
87
-
88
-
89
-
90
-
91
-
92
-
93
-
94
-
95
-
96
-
97
-
98
-
99
-
100
-
101
-
102
-
103
-
104
-
105
-
106
-
107
-
108
-
109
-
110
-
111
-
112
-
113
-
114
-
115
-
116
-
117
-
118
-
119
-
120
-
121
-
122
-
123
-
124
-
125
-
126
-
127
-
128
-
129
-
130
-
131
-
132
-
133
-
134
-
135
-
136
-
137
-
138
-
139
-
140
-
141
-
142
-
143
-
144
-
145
-
146
-
147
-
148
-
149
-
150
-
151
-
152
-
153
-
154
-
155
-
156
-
157
-
158
-
159
-
160
-
161
-
162
-
163
-
164
-
165
-
166
 |
 |

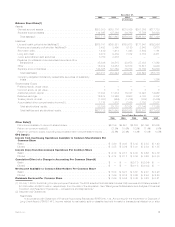
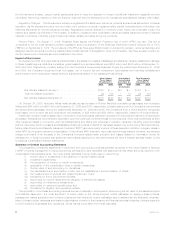
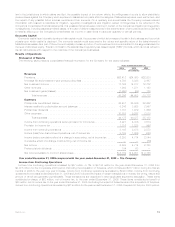
January 1, 2002 is presented as discontinued operations. The following information presents the components of income from
discontinued real estate operations:
2006 2005 2004 2003 2002
Years Ended December 31,
(In millions)
Investmentincome................................. $ 234 $ 395 $649 $719 $842
Investmentexpense................................ (150) (244) (388) (421) (466)
Netinvestmentgains(losses).......................... 4,795 2,125 146 420 585
Totalrevenues.................................. 4,879 2,276 407 718 961
Interestexpense .................................. — — 13 4 —
Provisionforincometax ............................. 1,723 808 138 261 349
Income from discontinued operations, net of income tax . . . . . . . $3,156 $1,468 $ 256 $ 453 $ 612
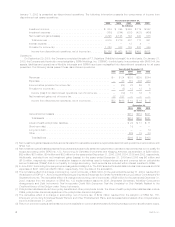
Operations
On September 29, 2005, the Company completed the sale of P.T. Sejahtera (“MetLife Indonesia”) to a third party. On January 31,
2005, the Company sold its wholly-owned subsidiary, SSRM Holdings, Inc. (“SSRM”), to a third party. In accordance with SFAS 144, the
assets, liabilities and operations of MetLife Indonesia and SSRM have been reclassified into discontinued operations for all years
presented. The following tables present these discontinued operations:
2006 2005 2004 2003 2002
Years Ended December 31,
(In millions)
Revenues ........................................... $— $ 24 $333 $235 $244
Expenses ........................................... — 48 310 206 233
Incomebeforeprovisionforincometax ........................ — (24) 23 29 11
Provisionforincometax.................................. — (5) 13 13 6
Income (loss) from discontinued operations, net of income tax . . . . . . . . — (19) 10 16 5
Netinvestmentgains,netofincometax........................ 32 187 — — —
Incomefromdiscontinuedoperations,netofincometax............ $32 $168 $ 10 $ 16 $ 5
2004 2003 2002
December 31,
(In millions)
Generalaccountassets............................................ $410 $210 $221
Totalassets .................................................. $410 $210 $221
Lifeandhealthpolicyholderliabilities.................................... $ 24 $ 17 $ 11
Short-termdebt ................................................. 19 — —
Long-termdebt.................................................. — — 14
Other........................................................ 225 73 83
Totalliabilities ................................................. $268 $ 90 $108
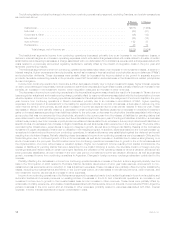
(3) Net investment gains (losses) exclude amounts related to real estate operations reported as discontinued operations in accordance with
SFAS 144.
(4) Net investment gains (losses) presented include scheduled periodic settlement payments on derivative instruments that do not qualify for
hedge accounting under SFAS No. 133, Accounting for Derivative Instruments and Hedging Activities, as amended, of $290 million,
$99 million, $51 million, $84 million and $32 million for the years ended December 31, 2006, 2005, 2004, 2003 and 2002, respectively.
Additionally, excluded from net investment gains (losses) for the years ended December 31, 2006 and 2005 was $6 million and
($13) million, respectively, related to revaluation losses on derivatives used to hedge interest rate and currency risk on policyholder
account balances (“PABs”) that do not qualify for hedge accounting. Such amounts are included within interest credited to PABs.
(5) In June 2002, the Holding Company acquired Aseguadora Hidalgo S.A. The 2002 selected financial data includes total revenues and total
expenses of $421 million and $358 million, respectively, from the date of the acquisition.
(6) The cumulative effect of a change in accounting, net of income tax, of $86 million for the year ended December 31, 2004, resulted from
the adoption of SOP 03-1, Accounting and Reporting by Insurance Enterprises for Certain Nontraditional Long-Duration Contracts and for
Separate Accounts. The cumulative effect of a change in accounting, net of income tax, of $26 million for the year ended December 31,
2003, resulted from the adoption of SFAS No. 133 Implementation Issue No. B36, Embedded Derivatives: Modified Coinsurance
Arrangements and Debt Instruments That Incorporate Credit Risk Exposures That Are Unrelated or Only Partially Related to the
Creditworthiness of the Obligor under Those Instruments.
(7) Policyholder liabilities include future policy benefits and other policyholder funds. The life and health policyholder liabilities also include
PABs, policyholder dividends payable and the policyholder dividend obligation.
(8) The cumulative effect of a change in accounting, net of income tax, of $744 million resulted from the adoption of SFAS No. 158,
Employers’ Accounting for Defined Benefit Pension and Other Postretirement Plans, and decreased accumulated other comprehensive
income at December 31, 2006.
(9) Return on common equity is defined as net income available to common shareholders divided by average common stockholders’ equity.
4MetLife, Inc.