MetLife 2006 Annual Report Download - page 71
Download and view the complete annual report
Please find page 71 of the 2006 MetLife annual report below. You can navigate through the pages in the report by either clicking on the pages listed below, or by using the keyword search tool below to find specific information within the annual report.-
 1
1 -
2
-
3
-
4
-
5
-
6
-
7
-
8
-
9
-
10
-
11
-
12
-
13
-
14
-
15
-
16
-
17
-
18
-
19
-
20
-
21
-
22
-
23
-
24
-
25
-
26
-
27
-
28
-
29
-
30
-
31
-
32
-
33
-
34
-
35
-
36
-
37
-
38
-
39
-
40
-
41
-
42
-
43
-
44
-
45
-
46
-
47
-
48
-
49
-
50
-
51
-
52
-
53
-
54
-
55
-
56
-
57
-
58
-
59
-
60
-
 61
61 -
 62
62 -
 63
63 -
 64
64 -
 65
65 -
 66
66 -
 67
67 -
 68
68 -
 69
69 -
 70
70 -
 71
71 -
 72
72 -
 73
73 -
 74
74 -
 75
75 -
 76
76 -
 77
77 -
 78
78 -
 79
79 -
 80
80 -
 81
81 -
82
-
83
-
84
-
85
-
86
-
87
-
88
-
89
-
90
-
91
-
92
-
93
-
94
-
95
-
96
-
97
-
98
-
99
-
100
-
101
-
102
-
103
-
104
-
105
-
106
-
107
-
108
-
109
-
110
-
111
-
112
-
113
-
114
-
115
-
116
-
117
-
118
-
119
-
120
-
121
-
122
-
123
-
124
-
125
-
126
-
127
-
128
-
129
-
130
-
131
-
132
-
133
-
134
-
135
-
136
-
137
-
138
-
139
-
140
-
141
-
142
-
143
-
144
-
145
-
146
-
147
-
148
-
149
-
150
-
151
-
152
-
153
-
154
-
155
-
156
-
157
-
158
-
159
-
160
-
161
-
162
-
163
-
164
-
165
-
166
 |
 |

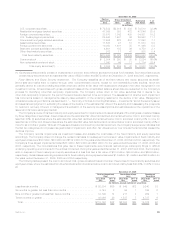
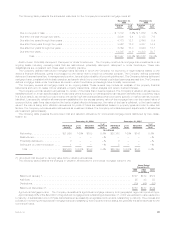
return by investing in domestic and foreign equities and equity-related securities utilizing such strategies as convertible securities arbitrage.
At December 31, 2005, MetLife was the majority owner of the feeder fund and consolidated the fund within its consolidated financial
statements. At December 31, 2005, $452 million of trading securities and $190 million of the short sale agreements were related to
Tribeca. Net investment income related to the trading activities of Tribeca, which included interest and dividends earned and net realized
and unrealized gains (losses), was $12 million and $6 million for the six months ended June 30, 2006 and the year ended December 31,
2005.
During the second quarter of 2006, MetLife’s ownership interests in Tribeca declined to a position whereby Tribeca is no longer
consolidated and, as of June 30, 2006, was accounted for under the equity method of accounting. The equity method investment at
December 31, 2006 of $82 million was included in other limited partnership interests. Net investment income related to the Company’s
equity method investment in Tribeca was $9 million for the six months ended December 31, 2006.
During the years ended December 31, 2006 and 2005, interest and dividends earned on trading securities in addition to the net realized
and unrealized gains (losses) recognized on the trading securities and the related short sale agreement liabilities totaled $71 million and
$14 million, respectively. Changes in the fair value of such trading securities and short sale agreement liabilities, totaled $26 million and
less than a million for the years ended December 31, 2006 and 2005, respectively. The Company did not have any trading securities during
the year ended December 31, 2004.
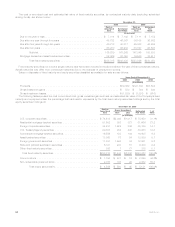
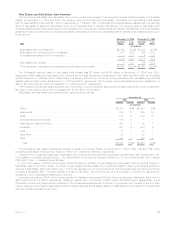
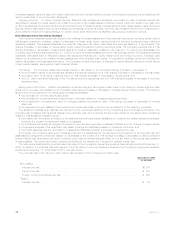
Mortgage and Consumer Loans
The Company’s mortgage and consumer loans are principally collateralized by commercial, agricultural and residential properties, as
well as automobiles. Mortgage and consumer loans comprised 12.7% and 12.2% of the Company’s total cash and invested assets at
December 31, 2006 and 2005, respectively. The carrying value of mortgage and consumer loans is stated at original cost net of
repayments, amortization of premiums, accretion of discounts and valuation allowances. The following table shows the carrying value of
the Company’s mortgage and consumer loans by type at:
Carrying
Value %of
Total Carrying
Value %of
Total
December 31, 2006 December 31, 2005
(In millions)
Commercialmortgageloans....................................... $31,847 75.4% $28,022 75.4%
Agriculturalmortgageloans ....................................... 9,213 21.8 7,700 20.7
Consumerloans............................................... 1,179 2.8 1,468 3.9
Total . . . . . . . . . . . . . . . . . . . . . . . . . . . . . . . . . . . . . . . . . . . . . . . . . $42,239 100.0% $37,190 100.0%
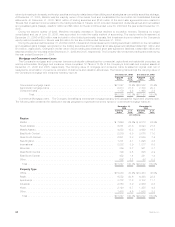
Commercial Mortgage Loans. The Company diversifies its commercial mortgage loans by both geographic region and property type.
The following table presents the distribution across geographic regions and property types for commercial mortgage loans at:
Carrying
Value %of
Total Carrying
Value %of
Total
December 31,
2006 December 31,
2005
(In millions)
Region
Pacific..................................................... $ 7,663 24.0% $ 6,818 24.3%
SouthAtlantic ................................................ 6,881 21.6 6,093 21.8
MiddleAtlantic................................................ 4,858 15.3 4,689 16.7
EastNorthCentral ............................................. 2,879 9.0 3,078 11.0
WestSouthCentral............................................. 2,631 8.3 2,069 7.4
NewEngland................................................. 1,301 4.1 1,295 4.6
International ................................................. 2,832 8.9 1,817 6.5
Mountain ................................................... 859 2.7 861 3.1
WestNorthCentral............................................. 799 2.5 825 2.9
EastSouthCentral............................................. 452 1.4 381 1.4
Other...................................................... 692 2.2 96 0.3
Total . . . . . . . . . . . . . . . . . . . . . . . . . . . . . . . . . . . . . . . . . . . . . . . . . . . . . $31,847 100.0% $28,022 100.0%
Property Type
Office ..................................................... $15,083 47.4% $13,453 48.0%
Retail...................................................... 6,552 20.6 6,398 22.8
Apartments.................................................. 3,772 11.8 3,102 11.1
Industrial.................................................... 2,850 8.9 2,656 9.5
Hotel...................................................... 2,120 6.7 1,355 4.8
Other...................................................... 1,470 4.6 1,058 3.8
Total . . . . . . . . . . . . . . . . . . . . . . . . . . . . . . . . . . . . . . . . . . . . . . . . . . . . . $31,847 100.0% $28,022 100.0%
68 MetLife, Inc.