MetLife 2006 Annual Report Download - page 20
Download and view the complete annual report
Please find page 20 of the 2006 MetLife annual report below. You can navigate through the pages in the report by either clicking on the pages listed below, or by using the keyword search tool below to find specific information within the annual report.-
 1
1 -
2
-
3
-
4
-
5
-
6
-
7
-
8
-
9
-
 10
10 -
 11
11 -
 12
12 -
 13
13 -
 14
14 -
 15
15 -
 16
16 -
 17
17 -
 18
18 -
 19
19 -
 20
20 -
 21
21 -
 22
22 -
 23
23 -
 24
24 -
 25
25 -
 26
26 -
 27
27 -
 28
28 -
 29
29 -
 30
30 -
31
-
32
-
33
-
34
-
35
-
36
-
37
-
38
-
39
-
40
-
41
-
42
-
43
-
44
-
45
-
46
-
47
-
48
-
49
-
50
-
51
-
52
-
53
-
54
-
55
-
56
-
57
-
58
-
59
-
60
-
61
-
62
-
63
-
64
-
65
-
66
-
67
-
68
-
69
-
70
-
71
-
72
-
73
-
74
-
75
-
76
-
77
-
78
-
79
-
80
-
81
-
82
-
83
-
84
-
85
-
86
-
87
-
88
-
89
-
90
-
91
-
92
-
93
-
94
-
95
-
96
-
97
-
98
-
99
-
100
-
101
-
102
-
103
-
104
-
105
-
106
-
107
-
108
-
109
-
110
-
111
-
112
-
113
-
114
-
115
-
116
-
117
-
118
-
119
-
120
-
121
-
122
-
123
-
124
-
125
-
126
-
127
-
128
-
129
-
130
-
131
-
132
-
133
-
134
-
135
-
136
-
137
-
138
-
139
-
140
-
141
-
142
-
143
-
144
-
145
-
146
-
147
-
148
-
149
-
150
-
151
-
152
-
153
-
154
-
155
-
156
-
157
-
158
-
159
-
160
-
161
-
162
-
163
-
164
-
165
-
166
 |
 |
comparable 2005 period. The 2006 and 2005 effective tax rates differ from the corporate tax rate of 35% primarily due to the impact of non-
taxable investment income and tax credits for investments in low income housing. The 2006 effective tax rate also includes an adjustment
of a benefit of $33 million consisting primarily of a revision in the estimate of income tax for 2005, and the 2005 effective tax rate also
includes a tax benefit of $27 million related to the repatriation of foreign earnings pursuant to Internal Revenue Code Section 965 for which
a U.S. deferred tax provision had previously been recorded and an adjustment of a benefit of $31 million consisting primarily of a revision in
theestimateofincometaxfor2004.
Income from discontinued operations consisted of net investment income and net investment gains related to real estate properties that
the Company had classified as available-for-sale or had sold and, for the years ended December 31, 2006 and 2005, the operations and
gain upon disposal from the sale of SSRM on January 31, 2005 and for the year ended December 31, 2005, the operations of MetLife
Indonesia which was sold on September 29, 2005. Income from discontinued operations, net of income tax, increased by $1,552 million,
or 95%, to $3,188 million for the year ended December 31, 2006 from $1,636 million for the comparable 2005 period. This increase is
primarily due to a gain of $3 billion, net of income tax, on the sale of the Peter Cooper Village and Stuyvesant Town properties in Manhattan,
New York, as well as a gain of $32 million, net of income tax, related to the sale of SSRM during the year ended December 31, 2006. This
increase was partially offset by gains during the year ended December 31, 2005 including $1,193 million, net of income tax, on the sales of
the One Madison Avenue and 200 Park Avenue properties in Manhattan, New York, as well as gains on the sales of SSRM and MetLife
Indonesia of $177 million and $10 million, respectively, both net of income tax. In addition, there was lower net investment income and net
investment gains from discontinued operations related to real estate properties sold or held-for-sale during the year ended December 31,
2006 compared to the year ended December 31, 2005.
Dividends on the Holding Company’s Preferred Shares issued in connection with financing the acquisition of Travelers increased by
$71 million, to $134 million for the year ended December 31, 2006, from $63 million for the comparable 2005 period, as the preferred
stock was issued in June 2005.
Year ended December 31, 2005 compared with the year ended December 31, 2004 — The Company
Income from Continuing Operations
Income from continuing operations increased by $500 million, or 19%, to $3,078 million for the year ended December 31, 2005 from
$2,578 million in the comparable 2004 period. The current period includes $233 million of income from continuing operations related to the
acquisition of Travelers. Included in the Travelers results is a charge for the establishment of an excess mortality reserve related to group of
specific policies. In connection with MetLife, Inc.’s acquisition of Travelers, the Company has performed reviews of Travelers underwriting
criteria in its effort to refine its estimated fair values for the purchase price allocation. As a result of these reviews and actuarial analyses,
and to be consistent with MetLife’s existing reserving methodologies, the Company has established an excess mortality reserve on a
specific group of policies. This resulted in a charge of $20 million, net of income tax, to fourth quarter results. The Company completed its
reviews and refined its estimate of the excess mortality reserve in the second quarter of 2006. Excluding the acquisition of Travelers,
income from continuing operations increased by $267 million, or 10%. Income from continuing operations for the year ended December 31,
2005 and 2004 includes the impact of certain transactions or events, the timing, nature and amount of which are generally unpredictable.
These transactions are described in each applicable segment’s discussion below. These items contributed a benefit of $40 million, net of
income tax, to the year ended December 31, 2005 and a benefit of $96 million, net of income tax, to the comparable 2004 period.
Excluding the impact of these items, income from continuing operations increased by $323 million for the year ended December 31, 2005
compared to the prior 2004 period. The Individual segment contributed $246 million, net of income tax, to the increase, as a result of
interest rate spreads, increased fee income related to the growth in separate account products, favorable underwriting, a decrease in the
closed block-related policyholder dividend obligation, lower annuity net guaranteed benefit costs and lower DAC amortization. These
increases were partially offset by lower net investment income, net investment losses and higher operating costs offset by revisions to
certain expense, premium tax and policyholder liability estimates in the current year and write-offs of certain assets in the prior year. The
Institutional segment contributed $47 million, net of income tax, to this increase primarily due to favorable interest spreads, partially offset
by a decrease in net investment gains, an adjustment recorded on DAC associated with certain LTC products in 2005, unfavorable
underwriting and an increase in other expenses. The Auto & Home segment contributed $16 million, net of income tax, to the 2005
increase primarily due to improvements in the development of prior year claims, the non-catastrophe combined ratio, and losses from the
involuntary Massachusetts automobile plan, as well as an increase in net investment income and earned premium. These increases in the
Auto & Home segment were partially offset by an increase in catastrophes as a result of the impact of Hurricanes Katrina and Wilma and an
increase in other expenses. The International segment contributed $9 million, net of income tax, primarily due to business growth in South
Korea, Chile and Mexico. These increases in the International segment were partially offset by an increase in certain policyholder liabilities
caused by unrealized investment gains (losses) on the invested assets supporting those liabilities, an increase in expenses for start up
costs and contingency liabilities in Mexico, as well as a decrease in Canada primarily due to a realignment of economic capital offset by the
strengthening of the liability on its pension business related to changes in mortality assumptions in the prior year and higher oversight and
infrastructure expenditures in support of the segment growth. Corporate & Other contributed $4 million, net of income tax, to this increase
primarily due to an increase in net investment income, higher net investment gains, a decrease in corporate support expenses and an
increase in tax benefits, partially offset by higher interest expense on debt, integration costs associated with the acquisition of Travelers,
higher interest credited on bank holder deposits and legal-related liabilities. The Reinsurance segment contributed $1 million, net of income
tax, to this increase primarily due to premium growth and higher net investment income, partially offset by unfavorable mortality as a result
of higher claim levels in the U.S. and the United Kingdom and a reduction in net investment gains.
Revenues and Expenses
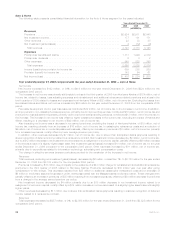
Premiums, Fees and Other Revenues
Premiums, fees and other revenues increased by $3,694 million, or 14%, to $29,959 million for the year ended December 31, 2005
from $26,265 million for the comparable 2004 period. The current period includes $1,009 million of premium, fees and other revenues
related to the acquisition of Travelers. Excluding the acquisition of Travelers, premium, fees and other revenues increased by $2,685 million,
or 10%. The Institutional segment contributed $1,266 million, or 47%, to the year over year increase. The Institutional segment increase is
primarily due to sales growth and the acquisition of new business in the non-medical health & other business, as well as improved sales
17MetLife, Inc.