MetLife 2006 Annual Report Download - page 114
Download and view the complete annual report
Please find page 114 of the 2006 MetLife annual report below. You can navigate through the pages in the report by either clicking on the pages listed below, or by using the keyword search tool below to find specific information within the annual report.-
 1
1 -
2
-
3
-
4
-
5
-
6
-
7
-
8
-
9
-
10
-
11
-
12
-
13
-
14
-
15
-
16
-
17
-
18
-
19
-
20
-
21
-
22
-
23
-
24
-
25
-
26
-
27
-
28
-
29
-
30
-
31
-
32
-
33
-
34
-
35
-
36
-
37
-
38
-
39
-
40
-
41
-
42
-
43
-
44
-
45
-
46
-
47
-
48
-
49
-
50
-
51
-
52
-
53
-
54
-
55
-
56
-
57
-
58
-
59
-
60
-
61
-
62
-
63
-
64
-
65
-
66
-
67
-
68
-
69
-
70
-
71
-
72
-
73
-
74
-
75
-
76
-
77
-
78
-
79
-
80
-
81
-
82
-
83
-
84
-
85
-
86
-
87
-
88
-
89
-
90
-
91
-
92
-
93
-
94
-
95
-
96
-
97
-
98
-
99
-
100
-
101
-
102
-
103
-
 104
104 -
 105
105 -
 106
106 -
 107
107 -
 108
108 -
 109
109 -
 110
110 -
 111
111 -
 112
112 -
 113
113 -
 114
114 -
 115
115 -
 116
116 -
 117
117 -
 118
118 -
 119
119 -
 120
120 -
 121
121 -
 122
122 -
 123
123 -
 124
124 -
125
-
126
-
127
-
128
-
129
-
130
-
131
-
132
-
133
-
134
-
135
-
136
-
137
-
138
-
139
-
140
-
141
-
142
-
143
-
144
-
145
-
146
-
147
-
148
-
149
-
150
-
151
-
152
-
153
-
154
-
155
-
156
-
157
-
158
-
159
-
160
-
161
-
162
-
163
-
164
-
165
-
166
 |
 |

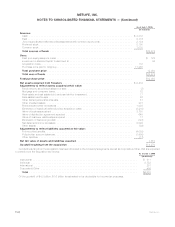
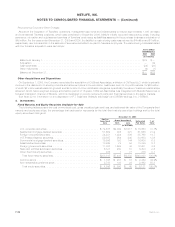
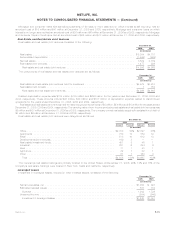
Mortgage and consumer loans with scheduled payments of 90 days or more past due on which interest is still accruing, had an
amortized cost of $15 million and $41 million at December 31, 2006 and 2005, respectively. Mortgage and consumer loans on which
interest is no longer accrued had an amortized cost of $36 million and $6 million at December 31, 2006 and 2005, respectively. Mortgage
and consumer loans in foreclosure had an amortized cost of $35 million and $13 million at December 31, 2006 and 2005, respectively.
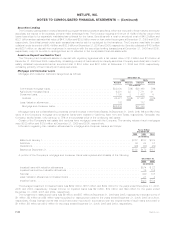
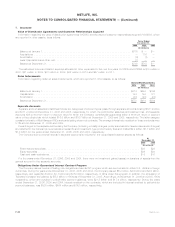
Real Estate and Real Estate Joint Ventures
Real estate and real estate joint ventures consisted of the following:
2006 2005
December 31,
(In millions)
Realestate ............................................................... $5,004 $4,707
Accumulateddepreciation ..................................................... (1,495) (968)
Netrealestate............................................................. 3,509 3,739
Realestatejointventures...................................................... 1,477 926
Realestateandrealestatejointventures .......................................... $4,986 $4,665
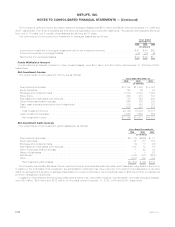
The components of real estate and real estate joint ventures are as follows:
2006 2005
December 31,
(In millions)
Realestateandrealestatejointventuresheld-for-investment ............................... $4,979 $3,910
Realestateheld-for-sale....................................................... 7 755
Realestateandrealestatejointventures........................................... $4,986 $4,665
Related depreciation expense was $158 million, $185 million and $286 million for the years ended December 31, 2006, 2005 and
2004, respectively. These amounts include $26 million, $50 million and $107 million of depreciation expense related to discontinued
operations for the years ended December 31, 2006, 2005 and 2004, respectively.
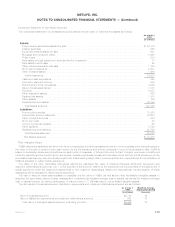
Real estate and real estate joint ventures held-for-sale recognized impairments of $8 million, $5 million and $13 million for the years ended
December 31, 2006, 2005 and 2004, respectively. The carrying value of non-income producing real estate and real estate joint ventures was
$8 million and $37 million at December 31, 2006 and 2005, respectively. The company owned real estate acquired in satisfaction of debt of
$3 million and $4 million at December 31, 2006 and 2005, respectively.
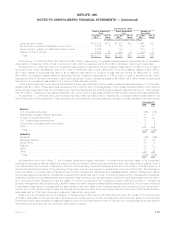
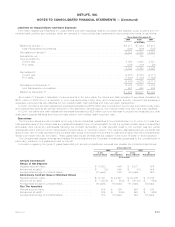
Real estate and real estate joint ventures were categorized as follows:
Amount Percent Amount Percent
2006 2005
December 31,
(In millions)
Office...................................................... $2,709 55% $2,597 56%
Apartments .................................................. 739 15 889 19
Retail ...................................................... 513 10 612 13
Developmentaljointventures....................................... 169 3 — —
Realestateinvestmentfunds....................................... 401 8 45 1
Industrial.................................................... 291 6 284 6
Land....................................................... 71 1 43 1
Agriculture................................................... 32 1 32 1
Other ...................................................... 61 1 163 3
Total ..................................................... $4,986 100% $4,665 100%
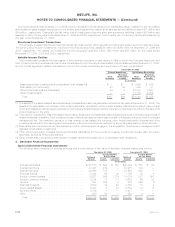
The Company’s real estate holdings are primarily located in the United States. At December 31, 2006, 26%, 15% and 15% of the
Company’s real estate holdings were located in New York, Texas and California, respectively.
Leveraged Leases
Investment in leveraged leases, included in other invested assets, consisted of the following:
2006 2005
December 31,
(In millions)
Rentalreceivables,net........................................................ $1,055 $ 991
Estimatedresidualvalues ...................................................... 887 735
Subtotal................................................................ 1,942 1,726
Unearnedincome ........................................................... (694) (645)
Investmentinleveragedleases ................................................. $1,248 $1,081
F-31MetLife, Inc.
METLIFE, INC.
NOTES TO CONSOLIDATED FINANCIAL STATEMENTS — (Continued)