MetLife 2006 Annual Report Download - page 76
Download and view the complete annual report
Please find page 76 of the 2006 MetLife annual report below. You can navigate through the pages in the report by either clicking on the pages listed below, or by using the keyword search tool below to find specific information within the annual report.-
 1
1 -
2
-
3
-
4
-
5
-
6
-
7
-
8
-
9
-
10
-
11
-
12
-
13
-
14
-
15
-
16
-
17
-
18
-
19
-
20
-
21
-
22
-
23
-
24
-
25
-
26
-
27
-
28
-
29
-
30
-
31
-
32
-
33
-
34
-
35
-
36
-
37
-
38
-
39
-
40
-
41
-
42
-
43
-
44
-
45
-
46
-
47
-
48
-
49
-
50
-
51
-
52
-
53
-
54
-
55
-
56
-
57
-
58
-
59
-
60
-
61
-
62
-
63
-
64
-
65
-
 66
66 -
 67
67 -
 68
68 -
 69
69 -
 70
70 -
 71
71 -
 72
72 -
 73
73 -
 74
74 -
 75
75 -
 76
76 -
 77
77 -
 78
78 -
 79
79 -
 80
80 -
 81
81 -
 82
82 -
 83
83 -
 84
84 -
 85
85 -
 86
86 -
87
-
88
-
89
-
90
-
91
-
92
-
93
-
94
-
95
-
96
-
97
-
98
-
99
-
100
-
101
-
102
-
103
-
104
-
105
-
106
-
107
-
108
-
109
-
110
-
111
-
112
-
113
-
114
-
115
-
116
-
117
-
118
-
119
-
120
-
121
-
122
-
123
-
124
-
125
-
126
-
127
-
128
-
129
-
130
-
131
-
132
-
133
-
134
-
135
-
136
-
137
-
138
-
139
-
140
-
141
-
142
-
143
-
144
-
145
-
146
-
147
-
148
-
149
-
150
-
151
-
152
-
153
-
154
-
155
-
156
-
157
-
158
-
159
-
160
-
161
-
162
-
163
-
164
-
165
-
166
 |
 |

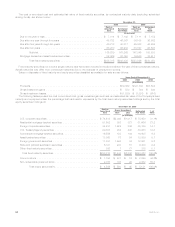
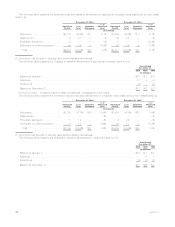
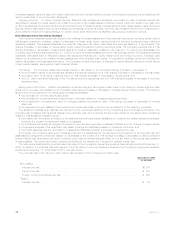
The following table presents the notional amounts and current market or fair value of derivative financial instruments held at:
Notional
Amount Assets Liabilities Notional
Amount Assets Liabilities
Current Market
or Fair Value Current Market
or Fair Value
December 31, 2006 December 31, 2005
(In millions)
Interestrateswaps ........................... $ 27,148 $ 639 $ 150 $20,444 $ 653 $ 69
Interestratefloors............................ 37,437 279 — 10,975 134 —
Interestratecaps ............................ 26,468 125 — 27,990 242 —
Financialfutures............................. 8,432 64 39 1,159 12 8
Foreign currency swaps . . . . . . . . . . . . . . . . . . . . . . . . 19,627 986 1,174 14,274 527 991
Foreigncurrencyforwards ...................... 2,934 31 27 4,622 64 92
Options .................................. 587 306 8 815 356 6
Financialforwards............................ 3,800 12 40 2,452 13 4
Creditdefaultswaps.......................... 6,357 5 21 5,882 13 11
SyntheticGICs.............................. 3,739 — — 5,477 — —
Other.................................... 250 56 — 250 9 —
Total ................................... $136,779 $2,503 $1,459 $94,340 $2,023 $1,181
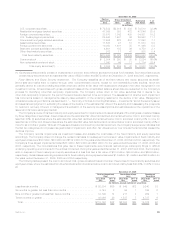
The above table does not include notional values for equity futures, equity financial forwards, and equity options. At December 31, 2006
and 2005, the Company owned 2,749 and 3,305 equity futures contracts, respectively. Market values of equity futures are included in
financial futures in the preceding table. At December 31, 2006 and 2005, the Company owned 225,000 and 213,000 equity financial
forwards, respectively. Market values of equity financial forwards are included in financial forwards in the preceding table. At December 31,
2006 and 2005, the Company owned 74,864,483 and 4,720,254 equity options, respectively. Market values of equity options are
included in options in the preceding table.
Credit Risk. The Company may be exposed to credit-related losses in the event of nonperformance by counterparties to derivative
financial instruments. Generally, the current credit exposure of the Company’s derivative contracts is limited to the fair value at the reporting
date. The credit exposure of the Company’s derivative transactions is represented by the fair value of contracts with a net positive fair value
at the reporting date.
The Company manages its credit risk related to over-the-counter derivatives by entering into transactions with creditworthy counter-
parties, maintaining collateral arrangements and through the use of master agreements that provide for a single net payment to be made by
one counterparty to another at each due date and upon termination. Because exchange traded futures are effected through regulated
exchanges, and positions are marked to market on a daily basis, the Company has minimal exposure to credit-related losses in the event of
nonperformance by counterparties to such derivative instruments.
The Company enters into various collateral arrangements, which require both the pledging and accepting of collateral in connection
with its derivative instruments. As of December 31, 2006 and 2005, the Company was obligated to return cash collateral under its control
of $428 million and $195 million, respectively. This unrestricted cash collateral is included in cash and cash equivalents and the obligation
to return it is included in payables for collateral under securities loaned and other transactions in the consolidated balance sheets. As of
December 31, 2006 and 2005, the Company had also accepted collateral consisting of various securities with a fair market value of
$453 million and $427 million, respectively, which are held in separate custodial accounts. The Company is permitted by contract to sell or
repledge this collateral, but as of December 31, 2006 and 2005, none of the collateral had been sold or repledged.
As of December 31, 2006 and 2005, the Company provided collateral of $80 million and $4 million, respectively, which is included in
fixed maturity securities in the consolidated balance sheets. In addition, the Company has exchange traded futures, which require the
pledging of collateral. As of December 31, 2006 and 2005, the Company pledged collateral of $105 million and $89 million, respectively,
which is included in fixed maturity securities. The counterparties are permitted by contract to sell or repledge this collateral.
Variable Interest Entities
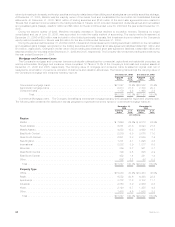
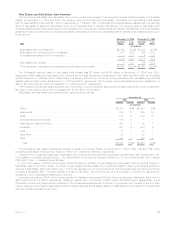
The following table presents the total assets of and maximum exposure to loss relating to VIEs for which the Company has concluded
that: (i) it is the primary beneficiary and which are consolidated in the Company’s consolidated financial statements at December 31, 2006;
and (ii) it holds significant variable interests but it is not the primary beneficiary and which have not been consolidated:
Total
Assets(1)
Maximum
Exposure to
Loss(2) Total
Assets(1)
Maximum
Exposure to
Loss(2)
Primary Beneficiary Not Primary Beneficiary
December 31, 2006
(In millions)
Asset-backed securitizations and collateralized debt obligations . . . . . . . . . . $ — $— $ 1,909 $ 246
Realestatejointventures(3) ................................. 53 45 399 41
Otherlimitedpartnershipinterests(4)............................ 84 3 20,770 1,583
Otherinvestments(5)...................................... — — 31,170 2,356
Total ............................................... $137 $48 $54,248 $4,226
73MetLife, Inc.