MetLife 2006 Annual Report Download - page 72
Download and view the complete annual report
Please find page 72 of the 2006 MetLife annual report below. You can navigate through the pages in the report by either clicking on the pages listed below, or by using the keyword search tool below to find specific information within the annual report.-
 1
1 -
2
-
3
-
4
-
5
-
6
-
7
-
8
-
9
-
10
-
11
-
12
-
13
-
14
-
15
-
16
-
17
-
18
-
19
-
20
-
21
-
22
-
23
-
24
-
25
-
26
-
27
-
28
-
29
-
30
-
31
-
32
-
33
-
34
-
35
-
36
-
37
-
38
-
39
-
40
-
41
-
42
-
43
-
44
-
45
-
46
-
47
-
48
-
49
-
50
-
51
-
52
-
53
-
54
-
55
-
56
-
57
-
58
-
59
-
60
-
61
-
 62
62 -
 63
63 -
 64
64 -
 65
65 -
 66
66 -
 67
67 -
 68
68 -
 69
69 -
 70
70 -
 71
71 -
 72
72 -
 73
73 -
 74
74 -
 75
75 -
 76
76 -
 77
77 -
 78
78 -
 79
79 -
 80
80 -
 81
81 -
 82
82 -
83
-
84
-
85
-
86
-
87
-
88
-
89
-
90
-
91
-
92
-
93
-
94
-
95
-
96
-
97
-
98
-
99
-
100
-
101
-
102
-
103
-
104
-
105
-
106
-
107
-
108
-
109
-
110
-
111
-
112
-
113
-
114
-
115
-
116
-
117
-
118
-
119
-
120
-
121
-
122
-
123
-
124
-
125
-
126
-
127
-
128
-
129
-
130
-
131
-
132
-
133
-
134
-
135
-
136
-
137
-
138
-
139
-
140
-
141
-
142
-
143
-
144
-
145
-
146
-
147
-
148
-
149
-
150
-
151
-
152
-
153
-
154
-
155
-
156
-
157
-
158
-
159
-
160
-
161
-
162
-
163
-
164
-
165
-
166
 |
 |

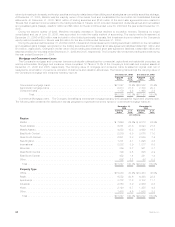
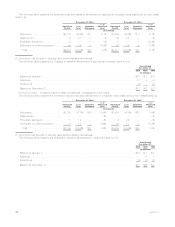
The following table presents the scheduled maturities for the Company’s commercial mortgage loans at:
Carrying
Value %of
Total Carrying
Value %of
Total
December 31,
2006 December 31,
2005
(In millions)
Dueinoneyearorless .......................................... $ 1,772 5.6% $ 1,052 3.8%
Dueafteroneyearthroughtwoyears................................. 3,006 9.4 2,138 7.6
Dueaftertwoyearsthroughthreeyears ............................... 4,173 13.1 2,640 9.4
Dueafterthreeyearsthroughfouryears ............................... 3,822 12.0 4,037 14.4
Dueafterfouryearsthroughfiveyears ................................ 4,769 15.0 3,946 14.1
Dueafterfiveyears............................................. 14,305 44.9 14,209 50.7
Total . . . . . . . . . . . . . . . . . . . . . . . . . . . . . . . . . . . . . . . . . . . . . . . . . $31,847 100.0% $28,022 100.0%
Restructured, Potentially Delinquent, Delinquent or Under Foreclosure. The Company monitors its mortgage loan investments on an
ongoing basis, including reviewing loans that are restructured, potentially delinquent, delinquent or under foreclosure. These loan
classifications are consistent with those used in industry practice.
The Company defines restructured mortgage loans as loans in which the Company, for economic or legal reasons related to the
debtor’s financial difficulties, grants a concession to the debtor that it would not otherwise consider. The Company defines potentially
delinquent loans as loans that, in management’s opinion, have a high probability of becoming delinquent. The Company defines delinquent
mortgage loans, consistent with industry practice, as loans in which two or more interest or principal payments are past due. The Company
defines mortgage loans under foreclosure as loans in which foreclosure proceedings have formally commenced.
The Company reviews all mortgage loans on an ongoing basis. These reviews may include an analysis of the property financial
statements and rent roll, lease rollover analysis, property inspections, market analysis and tenant creditworthiness.
The Company records valuation allowances for certain of the loans that it deems impaired. The Company’s valuation allowances are
established both on a loan specific basis for those loans where a property or market specific risk has been identified that could likely result
in a future default, as well as for pools of loans with similar high risk characteristics where a property specific or market risk has not been
identified. Loan specific valuation allowances are established for the excess carrying value of the mortgage loan over the present value of
expected future cash flows discounted at the loan’s original effective interest rate, the value of the loan’s collateral, or the loan’s market
value if the loan is being sold. Valuation allowances for pools of loans are established based on property types and loan to value risk
factors. The Company records valuation allowances as investment losses. The Company records subsequent adjustments to allowances
as investment gains (losses).
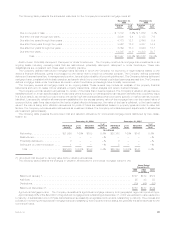
The following table presents the amortized cost and valuation allowance for commercial mortgage loans distributed by loan classi-
fication at:
Amortized
Cost(1) %of
Total Valuation
Allowance
%of
Amortized
Cost Amortized
Cost(1) %of
Total Valuation
Allowance
%of
Amortized
Cost
December 31, 2006 December 31, 2005
(In millions)
Performing.................. $31,996 100% $153 0.5% $28,158 100% $147 0.5%
Restructured................. — — — —% — — — —%
Potentiallydelinquent........... 3 — — —% 3 — — —%
Delinquent or under foreclosure . . . . 1 — — —% 8 — — —%
Total . . . . . . . . . . . . . . . . . . . . $32,000 100.0% $153 0.5% $28,169 100.0% $147 0.5%
(1) Amortized cost is equal to carrying value before valuation allowances.
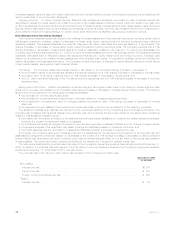
The following table presents the changes in valuation allowances for commercial mortgage loans for the:
2006 2005 2004
Years Ended
December 31,
(In millions)
BalanceatJanuary1,...................................................... $147 $149 $122
Additions.............................................................. 25 43 53
Deductions............................................................. (19) (45) (26)
BalanceatDecember31, ................................................... $153 $147 $149
Agricultural Mortgage Loans. The Company diversifies its agricultural mortgage loans by both geographic region and product type.
Approximately 60% of the $9.2 billion of agricultural mortgage loans outstanding at December 31, 2006 were subject to rate resets prior
to maturity. A substantial portion of these loans has been successfully renegotiated and remains outstanding to maturity. The process and
policies for monitoring the agricultural mortgage loans and classifying them by performance status are generally the same as those for the
commercial loans.
69MetLife, Inc.