MetLife 2006 Annual Report Download - page 35
Download and view the complete annual report
Please find page 35 of the 2006 MetLife annual report below. You can navigate through the pages in the report by either clicking on the pages listed below, or by using the keyword search tool below to find specific information within the annual report.-
 1
1 -
2
-
3
-
4
-
5
-
6
-
7
-
8
-
9
-
10
-
11
-
12
-
13
-
14
-
15
-
16
-
17
-
18
-
19
-
20
-
21
-
22
-
23
-
24
-
 25
25 -
 26
26 -
 27
27 -
 28
28 -
 29
29 -
 30
30 -
 31
31 -
 32
32 -
 33
33 -
 34
34 -
 35
35 -
 36
36 -
 37
37 -
 38
38 -
 39
39 -
 40
40 -
 41
41 -
 42
42 -
 43
43 -
 44
44 -
 45
45 -
46
-
47
-
48
-
49
-
50
-
51
-
52
-
53
-
54
-
55
-
56
-
57
-
58
-
59
-
60
-
61
-
62
-
63
-
64
-
65
-
66
-
67
-
68
-
69
-
70
-
71
-
72
-
73
-
74
-
75
-
76
-
77
-
78
-
79
-
80
-
81
-
82
-
83
-
84
-
85
-
86
-
87
-
88
-
89
-
90
-
91
-
92
-
93
-
94
-
95
-
96
-
97
-
98
-
99
-
100
-
101
-
102
-
103
-
104
-
105
-
106
-
107
-
108
-
109
-
110
-
111
-
112
-
113
-
114
-
115
-
116
-
117
-
118
-
119
-
120
-
121
-
122
-
123
-
124
-
125
-
126
-
127
-
128
-
129
-
130
-
131
-
132
-
133
-
134
-
135
-
136
-
137
-
138
-
139
-
140
-
141
-
142
-
143
-
144
-
145
-
146
-
147
-
148
-
149
-
150
-
151
-
152
-
153
-
154
-
155
-
156
-
157
-
158
-
159
-
160
-
161
-
162
-
163
-
164
-
165
-
166
 |
 |

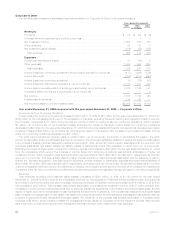
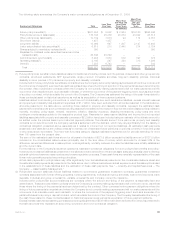
Reinsurance
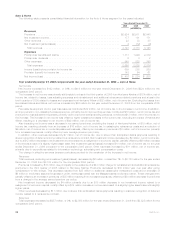
The following table presents consolidated financial information for the Reinsurance segment for the years indicated:
2006 2005 2004
Years Ended December 31,
(In millions)
Revenues
Premiums.................................................... $4,348 $3,869 $3,348
Netinvestmentincome............................................ 732 606 538
Otherrevenues ................................................ 66 58 56
Netinvestmentgains(losses) ....................................... 7 22 59
Totalrevenues................................................ 5,153 4,555 4,001
Expenses
Policyholderbenefitsandclaims ..................................... 3,490 3,206 2,694
Interestcreditedtopolicyholderaccountbalances.......................... 254 220 212
Policyholderdividends............................................ — — 1
Otherexpenses ................................................ 1,227 991 957
Totalexpenses ............................................... 4,971 4,417 3,864
Incomebeforeprovisionforincometax................................. 182 138 137
Provisionforincometax........................................... 64 46 46
Netincome................................................... $ 118 $ 92 $ 91
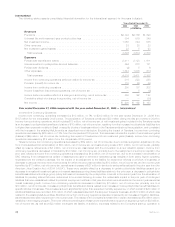
Year ended December 31, 2006 compared with the year ended December 31, 2005 — Reinsurance
Net Income
Net income increased by $26 million, or 28%, to $118 million for the year ended December 31, 2006 from $92 million for the
comparable 2005 period.
The increase in net income was attributable to a 12% increase in premiums while policyholder benefits and claims increased by 9%, a
21% increase in net investment income while interest credited to PABs increased by 15%, and a 14% increase in other revenues. The
increase in premiums, net of the increase in policyholder benefits and claims, added $127 million to net income which was primarily due to
added business in-force from facultative and automatic treaties and renewal premiums on existing blocks of business in the U.S. and
international operations. The increase in policyholder benefits and claims was partially offset by unfavorable mortality and an increase in the
liabilities associated with RGA’s Argentine pension business, both in the prior-year period. The increase in net investment income and
interest credited to PABs added $60 million to net income and was due to growth in the invested asset base. The increase in invested
assets, and net investment income, substantially derived from the issuance of notes and a collateral financing facility, which increased
interest expense within other expenses as described below. The increase in other revenues added $5 million to net income and was
primarily related to an increase in investment product fees on asset-intensive business and financial reinsurance fees during 2006, partially
offset by a decrease in foreign currency transaction gains in the prior-year period.
These increases in net income were partially offset by a $153 million increase in other expenses and a $10 million decrease in net
investment gains (losses), all net of income tax. Additionally, a higher effective tax rate in 2006 reduced net income by $3 million. The
increase in other expenses was primarily related to expenses associated with DAC, including reinsurance allowances paid, interest
expense associated with RGA’s issuance of $850 million 30-year notes to provide long-term collateral for Regulation XXX statutory
reserves in June 2006 and $400 million of junior subordinated notes in December 2005, minority interest expense, and equity
compensation expense.
Revenues
Total revenues, excluding net investment gains (losses), increased by $613 million, or 14%, to $5,146 million for the year ended
December 31, 2006 from $4,533 million for the comparable 2005 period.
The increase in such revenues was primarily associated with growth in premiums of $479 million from new facultative and automatic
treaties and renewal premiums on existing blocks of business in all RGA operating segments, including the U.S., which contributed
$220 million; Asia Pacific, which contributed $138 million; Canada, which contributed $86 million; and Europe and South Africa, which
contributed $35 million. Premium levels were significantly influenced by large transactions and reporting practices of ceding companies
and, as a result, can fluctuate from period to period.
Net investment income increased by $126 million, primarily due to growth in the invested asset base from net proceeds of RGA’s
$850 million 30-year notes offering in June 2006 and $400 million junior subordinated note offering in December 2005, positive operating
cash inflows and additional deposits associated with the coinsurance of annuity products. Investment yields were up slightly compared to
the prior-year period. The increase in net investment income was partially offset by a decrease related to a realignment of economic capital.
Other revenues increased by $8 million primarily due to an increase in investment product fees on asset-intensive business and
financial reinsurance fees during 2006, partially offset by a decrease in foreign currency transaction gains.
Additionally, a component of the increase in total revenues, excluding net investment gains (losses), was a $36 million increase
associated with foreign currency exchange rate movements.
32 MetLife, Inc.