MetLife 2006 Annual Report Download - page 115
Download and view the complete annual report
Please find page 115 of the 2006 MetLife annual report below. You can navigate through the pages in the report by either clicking on the pages listed below, or by using the keyword search tool below to find specific information within the annual report.-
 1
1 -
2
-
3
-
4
-
5
-
6
-
7
-
8
-
9
-
10
-
11
-
12
-
13
-
14
-
15
-
16
-
17
-
18
-
19
-
20
-
21
-
22
-
23
-
24
-
25
-
26
-
27
-
28
-
29
-
30
-
31
-
32
-
33
-
34
-
35
-
36
-
37
-
38
-
39
-
40
-
41
-
42
-
43
-
44
-
45
-
46
-
47
-
48
-
49
-
50
-
51
-
52
-
53
-
54
-
55
-
56
-
57
-
58
-
59
-
60
-
61
-
62
-
63
-
64
-
65
-
66
-
67
-
68
-
69
-
70
-
71
-
72
-
73
-
74
-
75
-
76
-
77
-
78
-
79
-
80
-
81
-
82
-
83
-
84
-
85
-
86
-
87
-
88
-
89
-
90
-
91
-
92
-
93
-
94
-
95
-
96
-
97
-
98
-
99
-
100
-
101
-
102
-
103
-
104
-
 105
105 -
 106
106 -
 107
107 -
 108
108 -
 109
109 -
 110
110 -
 111
111 -
 112
112 -
 113
113 -
 114
114 -
 115
115 -
 116
116 -
 117
117 -
 118
118 -
 119
119 -
 120
120 -
 121
121 -
 122
122 -
 123
123 -
 124
124 -
 125
125 -
126
-
127
-
128
-
129
-
130
-
131
-
132
-
133
-
134
-
135
-
136
-
137
-
138
-
139
-
140
-
141
-
142
-
143
-
144
-
145
-
146
-
147
-
148
-
149
-
150
-
151
-
152
-
153
-
154
-
155
-
156
-
157
-
158
-
159
-
160
-
161
-
162
-
163
-
164
-
165
-
166
 |
 |

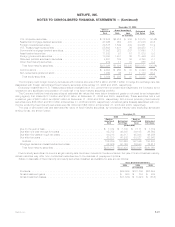
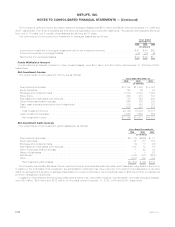
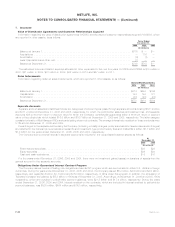
The Company’s deferred income tax liability related to leveraged leases was $670 million and $679 million at December 31, 2006 and
2005, respectively. The rental receivables set forth above are generally due in periodic installments. The payment periods generally range
from one to 15 years, but in certain circumstances are as long as 30 years.
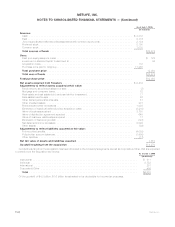
The components of net income from investment in leveraged leases are as follows:
2006 2005 2004
Years Ended
December 31,
(In millions)
Incomefrominvestmentinleveragedleases(includedinnetinvestmentincome) ................. $51 $54 $26
Incometaxexpenseonleveragedleases........................................... (18) (19) (9)
Netincomefromleveragedleases ............................................... $33 $35 $17
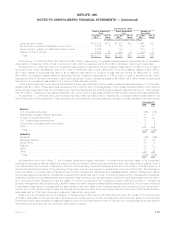
Funds Withheld at Interest
Funds withheld at interest, included in other invested assets, were $4.0 billion and $3.5 billion at December 31, 2006 and 2005,
respectively.
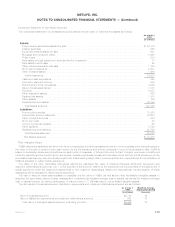
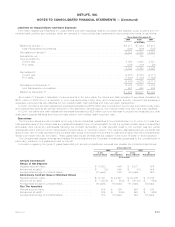
Net Investment Income
The components of net investment income are as follows:
2006 2005 2004
Years Ended December 31,
(In millions)
Fixedmaturitysecurities.............................................. $14,149 $11,400 $ 9,397
Equitysecurities................................................... 122 79 80
Mortgageandconsumerloans.......................................... 2,534 2,302 1,963
Policyloans...................................................... 603 572 541
Realestateandrealestatejointventures................................... 788 549 440
Otherlimitedpartnershipinterests ....................................... 945 709 324
Cash,cashequivalentsandshort-terminvestments............................ 519 400 167
Other.......................................................... 530 472 219
Totalinvestmentincome ............................................ 20,190 16,483 13,131
Less:Investmentexpenses............................................ 2,998 1,666 859
Netinvestmentincome ............................................. $17,192 $14,817 $12,272
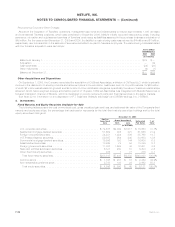
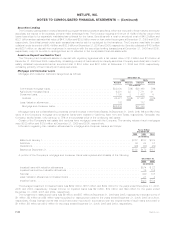
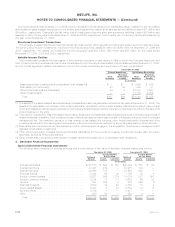
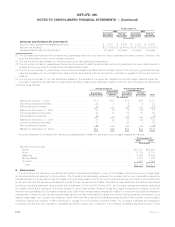
Net Investment Gains (Losses)
The components of net investment gains (losses) are as follows:
2006 2005 2004
Years Ended December 31,
(In millions)
Fixed maturity securities . . . . . . . . . . . . . . . . . . . . . . . . . . . . . . . . . . . . . . . . . . . . . . . . . . $(1,119) $(868) $ 71
Equitysecurities....................................................... 84 117 155
Mortgageandconsumerloans.............................................. (8) 17 (47)
Realestateandrealestatejointventures....................................... 102 14 16
Otherlimitedpartnershipinterests ........................................... 1 42 53
Salesofbusinesses .................................................... — 8 23
Derivatives........................................................... (169) 384 (255)
Other.............................................................. (241) 193 159
Netinvestmentgains(losses)............................................. $(1,350) $ (93) $175
The Company periodically disposes of fixed maturity and equity securities at a loss. Generally, such losses are insignificant in amount or
in relation to the cost basis of the investment, are attributable to declines in fair value occurring in the period of the disposition or are as a
result of management’s decision to sell securities based on current conditions or the Company’s need to shift the portfolio to maintain its
portfolio management objectives.
Losses from fixed maturity and equity securities deemed other-than-temporarily impaired, included within net investment gains (losses),
were $82 million, $64 million and $102 million for the years ended December 31, 2006, 2005 and 2004, respectively.
F-32 MetLife, Inc.
METLIFE, INC.
NOTES TO CONSOLIDATED FINANCIAL STATEMENTS — (Continued)