MetLife 2006 Annual Report Download - page 68
Download and view the complete annual report
Please find page 68 of the 2006 MetLife annual report below. You can navigate through the pages in the report by either clicking on the pages listed below, or by using the keyword search tool below to find specific information within the annual report.-
 1
1 -
2
-
3
-
4
-
5
-
6
-
7
-
8
-
9
-
10
-
11
-
12
-
13
-
14
-
15
-
16
-
17
-
18
-
19
-
20
-
21
-
22
-
23
-
24
-
25
-
26
-
27
-
28
-
29
-
30
-
31
-
32
-
33
-
34
-
35
-
36
-
37
-
38
-
39
-
40
-
41
-
42
-
43
-
44
-
45
-
46
-
47
-
48
-
49
-
50
-
51
-
52
-
53
-
54
-
55
-
56
-
57
-
 58
58 -
 59
59 -
 60
60 -
 61
61 -
 62
62 -
 63
63 -
 64
64 -
 65
65 -
 66
66 -
 67
67 -
 68
68 -
 69
69 -
 70
70 -
 71
71 -
 72
72 -
 73
73 -
 74
74 -
 75
75 -
 76
76 -
 77
77 -
 78
78 -
79
-
80
-
81
-
82
-
83
-
84
-
85
-
86
-
87
-
88
-
89
-
90
-
91
-
92
-
93
-
94
-
95
-
96
-
97
-
98
-
99
-
100
-
101
-
102
-
103
-
104
-
105
-
106
-
107
-
108
-
109
-
110
-
111
-
112
-
113
-
114
-
115
-
116
-
117
-
118
-
119
-
120
-
121
-
122
-
123
-
124
-
125
-
126
-
127
-
128
-
129
-
130
-
131
-
132
-
133
-
134
-
135
-
136
-
137
-
138
-
139
-
140
-
141
-
142
-
143
-
144
-
145
-
146
-
147
-
148
-
149
-
150
-
151
-
152
-
153
-
154
-
155
-
156
-
157
-
158
-
159
-
160
-
161
-
162
-
163
-
164
-
165
-
166
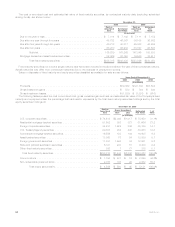
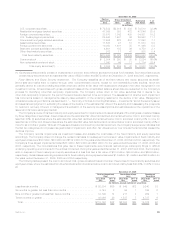
 |
 |

Cost or
Amortized
Cost Gain Loss Estimated
Fair Value %of
Total
Gross Unrealized
December 31, 2005
(In millions)
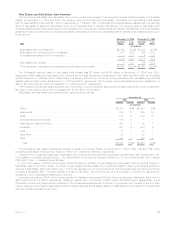
U.S.corporatesecurities................................ $ 72,532 $2,816 $ 838 $ 74,510 32.4%
Residential mortgage-backed securities . . . . . . . . . . . . . . . . . . . . . . 47,365 353 472 47,246 20.5
Foreigncorporatesecurities.............................. 33,578 1,842 439 34,981 15.2
U.S.Treasury/agencysecurities ........................... 25,643 1,401 86 26,958 11.7
Commercialmortgage-backedsecurities...................... 17,682 223 207 17,698 7.7
Asset-backedsecurities ................................ 11,533 91 51 11,573 5.0
Foreigngovernmentsecurities ............................ 10,080 1,401 35 11,446 5.0
Stateandpoliticalsubdivisionsecurities...................... 4,601 185 36 4,750 2.1
Otherfixedmaturitysecurities............................. 912 17 41 888 0.4
Total fixed maturity securities . . . . . . . . . . . . . . . . . . . . . . . . . . . . $223,926 $8,329 $2,205 $230,050 100.0%
Commonstock ...................................... $ 2,004 $ 250 $ 30 $ 2,224 66.6%
Non-redeemablepreferredstock........................... 1,080 45 11 1,114 33.4
Total equity securities(1) . . . . . . . . . . . . . . . . . . . . . . . . . . . $ 3,084 $ 295 $ 41 $ 3,338 100.0%
(1) Equity securities primarily consist of investments in common and preferred stocks and mutual fund interests. Such securities include
private equity securities with an estimated fair value of $238 million and $472 million at December 31, 2006 and 2005, respectively.
Fixed Maturity and Equity Security Impairment. The Company classifies all of its fixed maturity and equity securities as availa-
ble-for-sale and marks them to market through other comprehensive income, except for non-marketable private equities, which are
generally carried at cost and trading securities which are carried at fair value with subsequent changes in fair value recognized in net
investment income. All securities with gross unrealized losses at the consolidated balance sheet date are subjected to the Company’s
process for identifying other-than-temporary impairments. The Company writes down to fair value securities that it deems to be
other-than-temporarily impaired in the period the securities are deemed to be so impaired. The assessment of whether such impairment
has occurred is based on management’s case-by-case evaluation of the underlying reasons for the decline in fair value. Management
considers a wide range of factors, as described in “— Summary of Critical Accounting Estimates — Investments,” about the security issuer
and uses its best judgment in evaluating the cause of the decline in the estimated fair value of the security and in assessing the prospects
for near-term recovery. Inherent in management’s evaluation of the security are assumptions and estimates about the operations of the
issuer and its future earnings potential.
The Company’s review of its fixed maturity and equity securities for impairments includes an analysis of the total gross unrealized losses
by three categories of securities: (i) securities where the estimated fair value had declined and remained below cost or amortized cost by
less than 20%; (ii) securities where the estimated fair value had declined and remained below cost or amortized cost by 20% or more for
less than six months; and (iii) securities where the estimated fair value had declined and remained below cost or amortized cost by 20% or
more for six months or greater. While all of these securities are monitored for potential impairment, the Company’s experience indicates that
the first two categories do not present as great a risk of impairment, and often, fair values recover over time as the factors that caused the
declines improve.
The Company records impairments as investment losses and adjusts the cost basis of the fixed maturity and equity securities
accordingly. The Company does not change the revised cost basis for subsequent recoveries in value. Impairments of fixed maturity and
equity securities were $82 million, $64 million and $102 million for the years ended December 31, 2006, 2005 and 2004, respectively. The
Company’s three largest impairments totaled $33 million, $40 million and $53 million for the years ended December 31, 2006, 2005 and
2004, respectively. The circumstances that gave rise to these impairments were financial restructurings, bankruptcy filings or difficult
underlying operating environments for the entities concerned. During the years ended December 31, 2006, 2005 and 2004, the Company
sold or disposed of fixed maturity and equity securities at a loss that had a fair value of $70.3 billion, $93.9 billion and $29.9 billion,
respectively. Gross losses excluding impairments for fixed maturity and equity securities were $1.5 billion, $1.4 billion and $516 million for
the years ended December 31, 2006, 2005 and 2004 respectively.
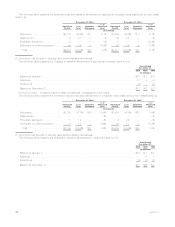
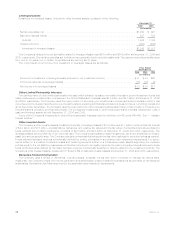
The following tables present the cost or amortized cost, gross unrealized loss and number of securities for fixed maturity securities and
equity securities, where the estimated fair value had declined and remained below cost or amortized cost by less than 20%, or 20% or more
at:
Less than
20% 20% or
more Less than
20% 20% or
more Less than
20% 20% or
more
Cost or Amortized
Cost Gross Unrealized
Loss Number of
Securities
December 31, 2006
(In millions, except number of securities)
Lessthansixmonths .................................. $ 52,384 $36 $ 549 $12 9,240 83
Sixmonthsorgreaterbutlessthanninemonths................. 3,143 3 56 1 706 2
Ninemonthsorgreaterbutlessthantwelvemonths .............. 12,199 14 211 4 989 1
Twelvemonthsorgreater................................ 48,066 29 1,537 7 4,787 6
Total............................................ $115,792 $82 $2,353 $24 15,722 92
65MetLife, Inc.