MetLife 2006 Annual Report Download - page 55
Download and view the complete annual report
Please find page 55 of the 2006 MetLife annual report below. You can navigate through the pages in the report by either clicking on the pages listed below, or by using the keyword search tool below to find specific information within the annual report.-
 1
1 -
2
-
3
-
4
-
5
-
6
-
7
-
8
-
9
-
10
-
11
-
12
-
13
-
14
-
15
-
16
-
17
-
18
-
19
-
20
-
21
-
22
-
23
-
24
-
25
-
26
-
27
-
28
-
29
-
30
-
31
-
32
-
33
-
34
-
35
-
36
-
37
-
38
-
39
-
40
-
41
-
42
-
43
-
44
-
 45
45 -
 46
46 -
 47
47 -
 48
48 -
 49
49 -
 50
50 -
 51
51 -
 52
52 -
 53
53 -
 54
54 -
 55
55 -
 56
56 -
 57
57 -
 58
58 -
 59
59 -
 60
60 -
 61
61 -
 62
62 -
 63
63 -
 64
64 -
 65
65 -
66
-
67
-
68
-
69
-
70
-
71
-
72
-
73
-
74
-
75
-
76
-
77
-
78
-
79
-
80
-
81
-
82
-
83
-
84
-
85
-
86
-
87
-
88
-
89
-
90
-
91
-
92
-
93
-
94
-
95
-
96
-
97
-
98
-
99
-
100
-
101
-
102
-
103
-
104
-
105
-
106
-
107
-
108
-
109
-
110
-
111
-
112
-
113
-
114
-
115
-
116
-
117
-
118
-
119
-
120
-
121
-
122
-
123
-
124
-
125
-
126
-
127
-
128
-
129
-
130
-
131
-
132
-
133
-
134
-
135
-
136
-
137
-
138
-
139
-
140
-
141
-
142
-
143
-
144
-
145
-
146
-
147
-
148
-
149
-
150
-
151
-
152
-
153
-
154
-
155
-
156
-
157
-
158
-
159
-
160
-
161
-
162
-
163
-
164
-
165
-
166
 |
 |

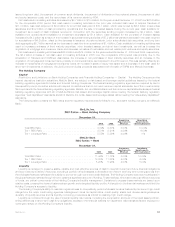
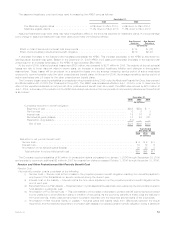
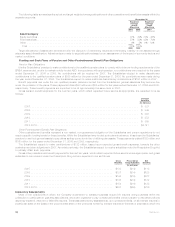
The aggregate projected benefit obligation and aggregate fair value of plan assets for the pension plans were as follows:
2006 2005 2006 2005 2006 2005
Qualified Plan Non-Qualified
Plan Total
(In millions)
Aggregate fair value of plan assets (principally Company contracts) . . . . . . . . $6,305 $5,518 $ — $ — $6,305 $5,518
Aggregate projected benefit obligation. . . . . . . . . . . . . . . . . . . . . . . . . . . 5,381 5,258 578 508 5,959 5,766
Over (under) funded status . . . . . . . . . . . . . . . . . . . . . . . . . . . . . . . . . . $ 924 $ 260 $(578) $(508) $ 346 $ (248)
The accumulated benefit obligation for all defined benefit pension plans was $5,505 million and $5,349 million at December 31, 2006
and 2005,respectively.
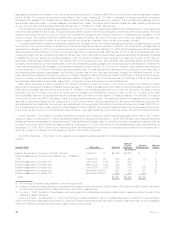
Information for pension plans with an accumulated benefit obligation in excess of plan assets is as follows:
2006 2005
December 31,
(In millions)
Projectedbenefitobligation........................................................ $594 $538
Accumulatedbenefitobligation ..................................................... $501 $449
Fairvalueofplanassets.......................................................... $ — $ 19
Information for pension and other postretirement plans with a projected benefit obligation in excess of plan assets is as follows:
2006 2005 2006 2005
Pension
Benefits
Other
Postretirement
Benefits
December 31,
(In millions)
Projectedbenefitobligation .......................................... $623 $538 $2,073 $2,176
Fairvalueofplanassets ............................................ $ 25 $ 19 $1,172 $1,093
Pension and Other Postretirement Benefit Plan Obligations
Pension Plan Obligations
Obligations, both PBO and ABO, of the defined benefit pension plans are determined using a variety of actuarial assumptions, from
which actual results may vary. Some of the more significant of these assumptions include the discount rate used to determine the present
value of future benefit payments, the expected rate of compensation increases and average expected retirement age.
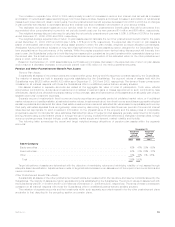
Assumptions used in determining pension plan obligations were as follows:
2006 2005
December 31,
Weightedaveragediscountrate................................................. 6.00% 5.82%
Rateofcompensationincrease................................................. 3%-8% 3%-8%
Averageexpectedretirementage................................................ 61 61
The discount rate is determined annually based on the yield, measured on a yield to worst basis, of a hypothetical portfolio constructed
of high-quality debt instruments available on the valuation date, which would provide the necessary future cash flows to pay the aggregate
PBO when due. The yield of this hypothetical portfolio, constructed of bonds rated AA or better by Moody’s Investors Services resulted in a
discount rate of approximately 6.00% and 5.82% for the defined pension plans as of December 31, 2006 and 2005, respectively.
A decrease (increase) in the discount rate increases (decreases) the PBO. This increase (decrease) to the PBO is amortized into
earnings as an actuarial loss (gain). Based on the December 31, 2006 PBO, a 25 basis point decrease (increase) in the discount rate would
result in an increase (decrease) in the PBO of approximately $180 million. At the end of 2006, total net actuarial losses were $1,123 million,
as compared to $1,528 million in 2005. The majority of these net actuarial losses are due to lower discount rates in recent years. These
losses will be amortized on a straight-line basis over the average remaining service period of active employees expected to receive benefits
under the benefit plans. At the end of 2006, the average remaining service period of active employees was 8.2 years for the pension plans.
As the benefits provided under the defined pension plans are calculated as a percentage of future earnings, an assumption of future
compensation increases is required to determine the projected benefit obligation. These rates are derived through periodic analysis of
historical demographic data conducted by an independent actuarial firm. The last review of such data was conducted using salary
information through 2003 and the Company believes that no circumstances have subsequently occurred that would result in a material
change to the compensation rate assumptions.
Other Postretirement Benefit Plan Obligations
The APBO is determined using a variety of actuarial assumptions, from which actual results may vary. Some of the more significant of
these assumptions include the discount rate, the healthcare cost trend rate and the average expected retirement age. The determination of
the discount rate and the average expected retirement age are substantially consistent with the determination described previously for the
pension plans.
52 MetLife, Inc.