MetLife 2006 Annual Report Download - page 27
Download and view the complete annual report
Please find page 27 of the 2006 MetLife annual report below. You can navigate through the pages in the report by either clicking on the pages listed below, or by using the keyword search tool below to find specific information within the annual report.-
 1
1 -
2
-
3
-
4
-
5
-
6
-
7
-
8
-
9
-
10
-
11
-
12
-
13
-
14
-
15
-
16
-
 17
17 -
 18
18 -
 19
19 -
 20
20 -
 21
21 -
 22
22 -
 23
23 -
 24
24 -
 25
25 -
 26
26 -
 27
27 -
 28
28 -
 29
29 -
 30
30 -
 31
31 -
 32
32 -
 33
33 -
 34
34 -
 35
35 -
 36
36 -
 37
37 -
38
-
39
-
40
-
41
-
42
-
43
-
44
-
45
-
46
-
47
-
48
-
49
-
50
-
51
-
52
-
53
-
54
-
55
-
56
-
57
-
58
-
59
-
60
-
61
-
62
-
63
-
64
-
65
-
66
-
67
-
68
-
69
-
70
-
71
-
72
-
73
-
74
-
75
-
76
-
77
-
78
-
79
-
80
-
81
-
82
-
83
-
84
-
85
-
86
-
87
-
88
-
89
-
90
-
91
-
92
-
93
-
94
-
95
-
96
-
97
-
98
-
99
-
100
-
101
-
102
-
103
-
104
-
105
-
106
-
107
-
108
-
109
-
110
-
111
-
112
-
113
-
114
-
115
-
116
-
117
-
118
-
119
-
120
-
121
-
122
-
123
-
124
-
125
-
126
-
127
-
128
-
129
-
130
-
131
-
132
-
133
-
134
-
135
-
136
-
137
-
138
-
139
-
140
-
141
-
142
-
143
-
144
-
145
-
146
-
147
-
148
-
149
-
150
-
151
-
152
-
153
-
154
-
155
-
156
-
157
-
158
-
159
-
160
-
161
-
162
-
163
-
164
-
165
-
166
 |
 |
Also partially offsetting the increase in income from continuing operations were higher annuity benefits of $30 million, net of income tax,
primarily due to higher costs of the guaranteed annuity benefit riders and the related hedging, and revisions to future policyholder benefits.
In addition, the increase in income from continuing operations was partially offset by an increase to interest credited to PABs due
primarily to lower amortization of the excess interest reserves on annuity and universal life blocks of business of $26 million, net of income
tax.
An increase in policyholder dividends of $18 million, net of income tax, due to growth in the business also partially offset the increase in
income from continuing operations.
The change in effective tax rates between periods accounts for the remainder of the increase in income from continuing operations.
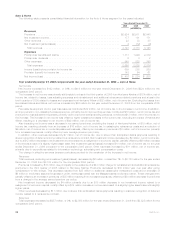
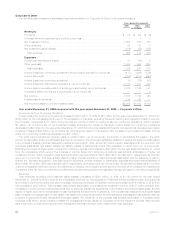
Revenues
Total revenues, excluding net investment gains (losses), increased by $1,184 million, or 8%, to $15,156 million for the year ended
December 31, 2006 from $13,972 million for the comparable 2005 period. The acquisition of Travelers contributed $1,009 million during
the first six months of 2006 to the period over period increase. Excluding the impact of Travelers, such revenues increased by $175 million,
or 1%, from the comparable 2005 period.
Premiums decreased by $38 million due to a decrease in immediate annuity premiums of $22 million, and a $103 million expected
decline in premiums associated with the Company’s closed block of business, partially offset by growth in premiums from other life
products of $87 million.
Higher universal life and investment-type product policy fees combined with other revenues of $267 million resulted from a combination
of growth in the business and improved overall market performance. Policy fees from variable life and annuity and investment-type products
are typically calculated as a percentage of the average assets in policyholder accounts. The value of these assets can fluctuate depending
on equity performance.
Net investment income decreased by $54 million. Net investment income from the general account portion of investment type products
decreased by $56 million which was partially offset by an increase of $2 million in other businesses. Management attributed a decrease of
$146 million partially to lower yields in the current year primarily resulting from lower income from securities lending activities, mortgage and
bond prepayment fee income, partially offset by higher corporate joint venture income. In addition, management attributed an increase of
$92 million from growth in the average asset base primarily from equity securities and mortgage loans.
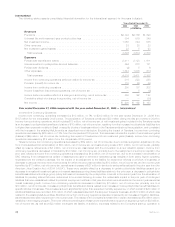
Expenses
Total expenses increased by $534 million, or 4%, to $12,660 million for the year ended December 31, 2006 from $12,126 million for the
comparable 2005 period. The acquisition of Travelers contributed $706 million during the first six months of 2006 to the period over period
increase. Included in the Travelers results was a $33 million increase to the excess mortality liability on specific blocks of life insurance
policies. Excluding the impact of Travelers, total expenses decreased by $172 million, or 1%, from the comparable 2005 period.
Policyholder benefits decreased by $156 million primarily due to favorable mortality in the life products of $109 million, as well as a
reduction in reserves of $49 million related to the excess mortality liability on a specific block of life insurance policies that lapsed or
otherwise changed. Also, policyholder benefits decreased due to a reduction in the closed block-related policyholder dividend obligation
of $6 million driven by higher net investment losses. In addition, policyholder benefits decreased commensurate with the premium
decreases in both immediate annuities and the Company’s closed block of business of $22 million and $103 million, respectively. Partially
offsetting this decline in benefits was an increase commensurate with the increase in premiums of $87 million from other life products.
Partially offsetting these decreases in policyholder benefits was an increase in annuity benefits of $46 million primarily due to higher costs
of the guaranteed annuity benefit riders and the related hedging, and revisions to future policyholder benefits.
Partially offsetting these decreases, interest credited to PABs increased by $51 million. Lower amortization of the excess interest
reserves on acquired annuity and universal life blocks of business resulting from higher lapses in the prior period, as well as an update of
assumptions in the current period contributed $40 million to the increase. In addition, there was an increase of $16 million on the general
account portion of investment type products. Management attributed this increase to higher crediting rates of $37 million, partially offset by
$21 million due to lower average PABs.
Partially offsetting these decreases in total expenses was a $27 million increase in policyholder dividends associated with growth in the
business.
Lower other expenses of $94 million include lower DAC amortization of $174 million resulting from changes in investment gains and
losses of $154 million and $20 million related to management’s update of assumptions used to determine estimated gross margins.
Excluding DAC amortization, other expenses increased by $80 million. The current year period included higher general spending of
$94 million primarily due to information technology and travel expenses while the prior year period had higher corporate incentives of
$39 million related to the Travelers integration. In addition, the impact of revisions to certain expenses, premium tax, policyholder liabilities
and pension and postretirement liabilities in both periods was a net increase to expenses of $25 million in the current period.
Year ended December 31, 2005 compared with the year ended December 31, 2004 — Individual
Income from Continuing Operations
Income from continuing operations increased by $342 million, or 40%, to $1,202 million for the year ended December 31, 2005 from
$860 million for the comparable 2004 period. The acquisition of Travelers accounted for $96 million of the increase which included
$66 million, net of income tax, of net investment losses. Included in the Travelers results was a charge for the establishment of an excess
mortality reserve related to group of specific policies. In connection with MetLife’s acquisition of Travelers, the Company had performed
reviews of Travelers underwriting criteria in an effort to refine its estimated fair values for the purchase allocation. As a result of these
reviews and actuarial analyses, and to be consistent with MetLife’s existing reserving methodologies, the Company has established an
excess mortality reserve on a specific group of policies. This resulted in a charge of $20 million, net of income tax, to fourth quarter results.
The Company completed its reviews and refined its estimate of the excess mortality reserve in the second quarter of 2006. Excluding the
impact of the acquisition of Travelers, income from continuing operations increased by $246 million, or 29%, for the comparable 2004
period. Included in this increase were net investment losses of $26 million, net of income tax.
An increase in interest margins of $117 million, net of income tax, compared to the prior year period contributed to the increase in
income from continuing operations. Interest margin relates primarily to the general account portion of investment-type products.
24 MetLife, Inc.