MetLife 2006 Annual Report Download - page 110
Download and view the complete annual report
Please find page 110 of the 2006 MetLife annual report below. You can navigate through the pages in the report by either clicking on the pages listed below, or by using the keyword search tool below to find specific information within the annual report.-
 1
1 -
2
-
3
-
4
-
5
-
6
-
7
-
8
-
9
-
10
-
11
-
12
-
13
-
14
-
15
-
16
-
17
-
18
-
19
-
20
-
21
-
22
-
23
-
24
-
25
-
26
-
27
-
28
-
29
-
30
-
31
-
32
-
33
-
34
-
35
-
36
-
37
-
38
-
39
-
40
-
41
-
42
-
43
-
44
-
45
-
46
-
47
-
48
-
49
-
50
-
51
-
52
-
53
-
54
-
55
-
56
-
57
-
58
-
59
-
60
-
61
-
62
-
63
-
64
-
65
-
66
-
67
-
68
-
69
-
70
-
71
-
72
-
73
-
74
-
75
-
76
-
77
-
78
-
79
-
80
-
81
-
82
-
83
-
84
-
85
-
86
-
87
-
88
-
89
-
90
-
91
-
92
-
93
-
94
-
95
-
96
-
97
-
98
-
99
-
 100
100 -
 101
101 -
 102
102 -
 103
103 -
 104
104 -
 105
105 -
 106
106 -
 107
107 -
 108
108 -
 109
109 -
 110
110 -
 111
111 -
 112
112 -
 113
113 -
 114
114 -
 115
115 -
 116
116 -
 117
117 -
 118
118 -
 119
119 -
 120
120 -
121
-
122
-
123
-
124
-
125
-
126
-
127
-
128
-
129
-
130
-
131
-
132
-
133
-
134
-
135
-
136
-
137
-
138
-
139
-
140
-
141
-
142
-
143
-
144
-
145
-
146
-
147
-
148
-
149
-
150
-
151
-
152
-
153
-
154
-
155
-
156
-
157
-
158
-
159
-
160
-
161
-
162
-
163
-
164
-
165
-
166
 |
 |

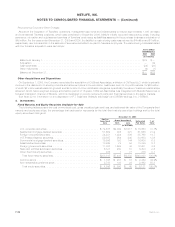
Cost or
Amortized
Cost Gain Loss Estimated
Fair Value %of
Total
Gross Unrealized
December 31, 2005
(In millions)
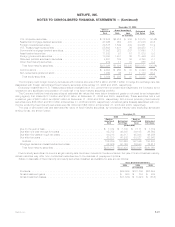
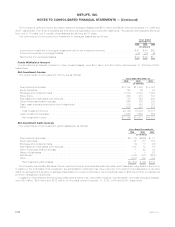
U.S.corporatesecurities................................ $ 72,532 $2,816 $ 838 $ 74,510 32.4%
Residential mortgage-backed securities . . . . . . . . . . . . . . . . . . . . . . 47,365 353 472 47,246 20.5
Foreigncorporatesecurities.............................. 33,578 1,842 439 34,981 15.2
U.S.Treasury/agencysecurities ........................... 25,643 1,401 86 26,958 11.7
Commercialmortgage-backedsecurities...................... 17,682 223 207 17,698 7.7
Asset-backedsecurities ................................ 11,533 91 51 11,573 5.0
Foreigngovernmentsecurities ............................ 10,080 1,401 35 11,446 5.0
Stateandpoliticalsubdivisionsecurities...................... 4,601 185 36 4,750 2.1
Otherfixedmaturitysecurities............................. 912 17 41 888 0.4
Total fixed maturity securities . . . . . . . . . . . . . . . . . . . . . . . . . . . . $223,926 $8,329 $2,205 $230,050 100.0%
Commonstock ...................................... $ 2,004 $ 250 $ 30 $ 2,224 66.6%
Non-redeemablepreferredstock........................... 1,080 45 11 1,114 33.4
Total equity securities . . . . . . . . . . . . . . . . . . . . . . . . . . . . . . . . . $ 3,084 $ 295 $ 41 $ 3,338 100.0%
The Company held foreign currency derivatives with notional amounts of $8.9 billion and $5.7 billion to hedge the exchange rate risk
associated with foreign denominated fixed maturity securities at December 31, 2006 and 2005, respectively.
Excluding investments in U.S. Treasury securities and obligations of U.S. government corporations and agencies, the Company is not
exposed to any significant concentration of credit risk in its fixed maturity securities portfolio.
The Company held fixed maturity securities at estimated fair values that were below investment grade or not rated by an independent
rating agency that totaled $17.3 billion and $15.2 billion at December 31, 2006 and 2005, respectively. These securities had a net
unrealized gain of $627 million and $392 million at December 31, 2006 and 2005, respectively. Non-income producing fixed maturity
securities were $16 million and $15 million at December 31, 2006 and 2005, respectively. Unrealized gains (losses) associated with non-
income producing fixed maturity securities were $4 million and ($3) million at December 31, 2006 and 2005, respectively.
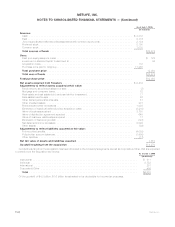
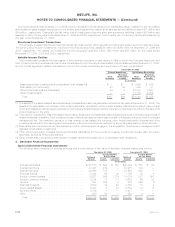
The cost or amortized cost and estimated fair value of fixed maturity securities, by contractual maturity date (excluding scheduled
sinking funds), are shown below:
Cost or
Amortized
Cost Estimated
Fair Value
Cost or
Amortized
Cost Estimated
Fair Value
2006 2005
December 31,
(In millions)
Dueinoneyearorless.................................... $ 7,014 $ 7,102 $ 7,111 $ 7,152
Due after one year through five years . . . . . . . . . . . . . . . . . . . . . . . . . . 45,782 46,367 36,105 36,562
Due after five years through ten years . . . . . . . . . . . . . . . . . . . . . . . . . . 40,213 40,817 45,303 46,256
Dueaftertenyears ...................................... 63,280 66,982 58,827 63,563
Subtotal . . . . . . . . . . . . . . . . . . . . . . . . . . . . . . . . . . . . . . . . . . . . 156,289 161,268 147,346 153,533
Mortgage-backed and asset-backed securities . . . . . . . . . . . . . . . . . . . . 82,026 82,160 76,580 76,517
Totalfixedmaturitysecurities .............................. $238,315 $243,428 $223,926 $230,050
Fixed maturity securities not due at a single maturity date have been included in the above table in the year of final contractual maturity.
Actual maturities may differ from contractual maturities due to the exercise of prepayment options.
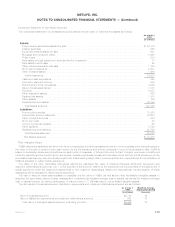
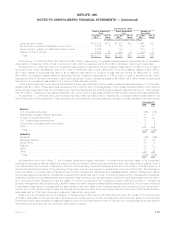
Sales or disposals of fixed maturity and equity securities classified as available-for-sale are as follows:
2006 2005 2004
Years Ended December 31,
(In millions)
Proceeds....................................................... $89,869 $127,709 $57,604
Grossinvestmentgains ............................................. $ 580 $ 704 $ 844
Grossinvestmentlosses............................................. $(1,533) $ (1,391) $ (516)
F-27MetLife, Inc.
METLIFE, INC.
NOTES TO CONSOLIDATED FINANCIAL STATEMENTS — (Continued)