MetLife 2006 Annual Report Download - page 30
Download and view the complete annual report
Please find page 30 of the 2006 MetLife annual report below. You can navigate through the pages in the report by either clicking on the pages listed below, or by using the keyword search tool below to find specific information within the annual report.-
 1
1 -
2
-
3
-
4
-
5
-
6
-
7
-
8
-
9
-
10
-
11
-
12
-
13
-
14
-
15
-
16
-
17
-
18
-
19
-
 20
20 -
 21
21 -
 22
22 -
 23
23 -
 24
24 -
 25
25 -
 26
26 -
 27
27 -
 28
28 -
 29
29 -
 30
30 -
 31
31 -
 32
32 -
 33
33 -
 34
34 -
 35
35 -
 36
36 -
 37
37 -
 38
38 -
 39
39 -
 40
40 -
41
-
42
-
43
-
44
-
45
-
46
-
47
-
48
-
49
-
50
-
51
-
52
-
53
-
54
-
55
-
56
-
57
-
58
-
59
-
60
-
61
-
62
-
63
-
64
-
65
-
66
-
67
-
68
-
69
-
70
-
71
-
72
-
73
-
74
-
75
-
76
-
77
-
78
-
79
-
80
-
81
-
82
-
83
-
84
-
85
-
86
-
87
-
88
-
89
-
90
-
91
-
92
-
93
-
94
-
95
-
96
-
97
-
98
-
99
-
100
-
101
-
102
-
103
-
104
-
105
-
106
-
107
-
108
-
109
-
110
-
111
-
112
-
113
-
114
-
115
-
116
-
117
-
118
-
119
-
120
-
121
-
122
-
123
-
124
-
125
-
126
-
127
-
128
-
129
-
130
-
131
-
132
-
133
-
134
-
135
-
136
-
137
-
138
-
139
-
140
-
141
-
142
-
143
-
144
-
145
-
146
-
147
-
148
-
149
-
150
-
151
-
152
-
153
-
154
-
155
-
156
-
157
-
158
-
159
-
160
-
161
-
162
-
163
-
164
-
165
-
166
 |
 |
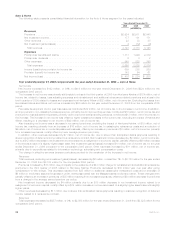
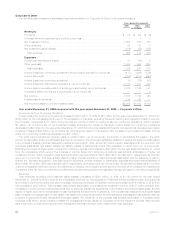
Policyholder benefits and claims decreased by $277 million which was primarily due to $196 million in claims and expenses related to
Hurricanes Katrina and Wilma incurred in 2005. The remainder of the decrease in policyholder benefits and claims for the year ended
December 31, 2006, as compared to the same period in 2005, can be attributed to $111 million in additional favorable development of
prior year losses, improvements in claim frequencies of $72 million and a decrease of $20 million in unallocated loss expense due primarily
to improved claims handling practices. These decreases in policyholder benefits and claims for the year ended December 31, 2006,
compared to the same period in 2005, were partially offset by $32 million of additional losses due to severity, $15 million of additional
losses due to exposure growth and a $75 million increase in catastrophe losses, excluding Hurricanes Katrina and Wilma.
Other expenses increased by $17 million primarily due to expenditures related to information technology, advertising and compensation
costs.
Underwriting results, excluding catastrophes, in the Auto & Home segment were favorable for the year ended December 31, 2006, as
the combined ratio, excluding catastrophes, decreased to 82.8% from 86.7% for the year ended December 31, 2005.
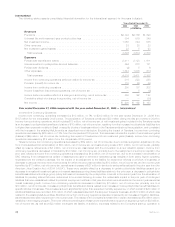
Year ended December 31, 2005 compared with the year ended December 31, 2004 — Auto & Home
Net Income
Net income increased by $16 million, or 8%, to $224 million for the year ended December 31, 2005 from $208 million for the
comparable 2004 period.
The increase was primarily the result of improvements in the development of prior years claims of $40 million, net of income tax, and an
improvement in the non-catastrophe combined ratio resulting in $16 million, net of income tax, primarily due to lower automobile and
homeowner claim frequencies.
Also contributing to this increase in net income was an improvement in losses from the involuntary Massachusetts automobile plan of
$12 million, net of income tax, an increase in net investment income of $6 million, net of income tax, and an increase in earned premium of
$4 million, net of income tax, as discussed below.
Offsetting these improved results, was an increase in catastrophes, including Hurricanes Katrina and Wilma of $63 million, net of
income tax.
Revenues
Total revenues, excluding net investment gains (losses), decreased by $29 million, or 1%, to $3,125 million for the year ended
December 31, 2005 from $3,154 million for the comparable 2004 period.
This decrease was primarily attributable to reinstatement and additional reinsurance-related premiums due to Hurricane Katrina of
$43 million.
This decrease was partially offset by higher net investment income of $10 million, primarily due to a change in the allocation of
economic capital, offset by a lower yield on a slightly higher invested asset base and an increase in earned premium of $6 million primarily
due to rate increases, higher inflation guard endorsements and higher insurance-to-value programs, all in the homeowners business.
Expenses
Total expenses decreased by $51 million, or 2%, to $2,825 million for the year ended December 31, 2005 from $2,876 million for the
comparable 2004 period.
This decrease was predominantly due to improved non-catastrophe losses of $32 million. This was primarily due to lower non-
catastrophe automobile and homeowner claim frequencies of $18 million and a smaller exposure base of $15 million for the year ended
December 31, 2005 versus the comparable 2004 period. Improvement in the development of losses reported in prior years contributed
$61 million. Unallocated claim expenses, excluding the expenses associated with Hurricane Katrina, decreased by $28 million mainly due
to a smaller increase in the year over year change in unallocated claim expense liability due to a smaller increase in the related loss reserve
and related unallocated claim expense reserve rate. Assumed losses from the involuntary Massachusetts automobile plan decreased by
$18 million primarily due to improved claim frequency and severity trends.
These improvements were partially offset by an increase in catastrophe losses, including Hurricanes Katrina and Wilma, of $54 million
and an increase in other expenses of $33 million primarily as a result of higher information technology, advertising and compensation costs.
The combined ratio, excluding catastrophes and before the reinstatement premiums and other reinsurance-related premium adjust-
ments due to Hurricane Katrina, was 86.7% for the year ended December 31, 2005 versus 90.4% for the comparable 2004 period.
27MetLife, Inc.