MetLife 2006 Annual Report Download - page 23
Download and view the complete annual report
Please find page 23 of the 2006 MetLife annual report below. You can navigate through the pages in the report by either clicking on the pages listed below, or by using the keyword search tool below to find specific information within the annual report.-
 1
1 -
2
-
3
-
4
-
5
-
6
-
7
-
8
-
9
-
10
-
11
-
12
-
 13
13 -
 14
14 -
 15
15 -
 16
16 -
 17
17 -
 18
18 -
 19
19 -
 20
20 -
 21
21 -
 22
22 -
 23
23 -
 24
24 -
 25
25 -
 26
26 -
 27
27 -
 28
28 -
 29
29 -
 30
30 -
 31
31 -
 32
32 -
 33
33 -
34
-
35
-
36
-
37
-
38
-
39
-
40
-
41
-
42
-
43
-
44
-
45
-
46
-
47
-
48
-
49
-
50
-
51
-
52
-
53
-
54
-
55
-
56
-
57
-
58
-
59
-
60
-
61
-
62
-
63
-
64
-
65
-
66
-
67
-
68
-
69
-
70
-
71
-
72
-
73
-
74
-
75
-
76
-
77
-
78
-
79
-
80
-
81
-
82
-
83
-
84
-
85
-
86
-
87
-
88
-
89
-
90
-
91
-
92
-
93
-
94
-
95
-
96
-
97
-
98
-
99
-
100
-
101
-
102
-
103
-
104
-
105
-
106
-
107
-
108
-
109
-
110
-
111
-
112
-
113
-
114
-
115
-
116
-
117
-
118
-
119
-
120
-
121
-
122
-
123
-
124
-
125
-
126
-
127
-
128
-
129
-
130
-
131
-
132
-
133
-
134
-
135
-
136
-
137
-
138
-
139
-
140
-
141
-
142
-
143
-
144
-
145
-
146
-
147
-
148
-
149
-
150
-
151
-
152
-
153
-
154
-
155
-
156
-
157
-
158
-
159
-
160
-
161
-
162
-
163
-
164
-
165
-
166
 |
 |

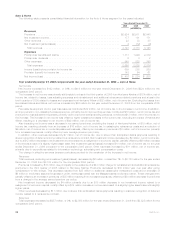
Institutional
The following table presents consolidated financial information for the Institutional segment for the years indicated:
2006 2005 2004
Years Ended December 31,
(In millions)
Revenues
Premiums.................................................. $11,867 $11,387 $10,037
Universallifeandinvestment-typeproductpolicyfees..................... 775 772 711
Netinvestmentincome......................................... 7,267 5,943 4,566
Otherrevenues.............................................. 685 653 654
Netinvestmentgains(losses)..................................... (631) (10) 163
Totalrevenues............................................. 19,963 18,745 16,131
Expenses
Policyholderbenefitsandclaims................................... 13,367 12,776 11,173
Interest credited to policyholder account balances . . . . . . . . . . . . . . . . . . . . . . . 2,593 1,652 1,016
Policyholderdividends ......................................... — 1 —
Otherexpenses.............................................. 2,314 2,229 1,972
Totalexpenses............................................. 18,274 16,658 14,161
Income from continuing operations before provision for income tax. . . . . . . . . . . . . 1,689 2,087 1,970
Provisionforincometax ........................................ 563 699 671
Incomefromcontinuingoperations ................................. 1,126 1,388 1,299
Income(loss)fromdiscontinuedoperations,netofincometax ............... 41 174 28
Income before cumulative effect of a change in accounting, net of income tax . . . . . 1,167 1,562 1,327
Cumulative effect of a change in accounting, net of income tax . . . . . . . . . . . . . . . — — (60)
Netincome ................................................ $ 1,167 $ 1,562 $ 1,267
Year ended December 31, 2006 compared with the year ended December 31, 2005 — Institutional
Income from Continuing Operations
Income from continuing operations decreased $262 million, or 19%, to $1,126 million for the year ended December 31, 2006 from
$1,388 million for the comparable 2005 period. The acquisition of Travelers contributed $56 million during the first six months of 2006 to
income from continuing operations, which included a decline of $104 million, net of income tax, of net investment gains (losses). Excluding
the impact of Travelers, income from continuing operations decreased $318 million, or 23%, from the comparable 2005 period.
Included in this decrease was a decline of $300 million, net of income tax, in net investment gains (losses), as well as a decline of
$18 million, net of income tax, resulting from an increase in policyholder benefits and claims related to net investment gains (losses).
Excluding the impact of Travelers and the decline in net investment gains (losses), income from continuing operations was flat when
compared to the prior year period.
A decrease in interest margins of $84 million, net of income tax, compared to the prior year period contributed to the decrease in
income from continuing operations. Management attributes this decrease primarily to the group life and retirement & savings businesses of
$60 million and $51 million, both net of income tax, respectively. Partially offsetting these decreases was an increase of $27 million, net of
income tax, in the non-medical health & other business. Interest margin is the difference between interest earned and interest credited to
PABs. Interest earned approximates net investment income on investable assets attributed to the segment with minor adjustments related
to the consolidation of certain separate accounts and other minor non-policyholder elements. Interest credited is the amount attributed to
insurance products, recorded in policyholder’s benefits, and the amount credited to PABs for investment-type products, recorded in
interest credited to PABs. Interest credited on insurance products reflects the current period impact of the interest rate assumptions
established at issuance or acquisition. Interest credited to PABs is subject to contractual terms, including some minimum guarantees. This
tends to move gradually over time to reflect market interest rate movements, may reflect actions by management to respond to competitive
pressures and therefore, generally does not introduce volatility in expense.
The year over year variance in income from continuing operations included charges recorded in other expenses of $17 million, net of
income tax, associated with costs related to the sale of certain small market recordkeeping businesses, $16 million, net of income tax, due
to costs associated with a previously announced regulatory settlement and $15 million, net of income tax, associated with non-deferrable
LTC commission expense. Partially offsetting these increases in operating expenses were benefits due to prior year charges of $28 million,
net of income tax, as a result of the impact of Travelers’ integration costs and $14 million, net of income tax, related to an adjustment of
DAC for certain LTC products.
Partially offsetting these decreases in income from continuing operations was an increase in underwriting results of $97 million, net of
income tax, compared to the prior year period. This increase was primarily due to favorable results of $48 million, $38 million and
$11 million, all net of income tax, in the group life, the non-medical health & other businesses and the retirement & savings businesses,
respectively.
The results in group life were primarily due to favorable mortality results, predominantly in the term life business, which included a
benefit from reserve refinements in the current year.
20 MetLife, Inc.