MetLife 2006 Annual Report Download - page 46
Download and view the complete annual report
Please find page 46 of the 2006 MetLife annual report below. You can navigate through the pages in the report by either clicking on the pages listed below, or by using the keyword search tool below to find specific information within the annual report.-
 1
1 -
2
-
3
-
4
-
5
-
6
-
7
-
8
-
9
-
10
-
11
-
12
-
13
-
14
-
15
-
16
-
17
-
18
-
19
-
20
-
21
-
22
-
23
-
24
-
25
-
26
-
27
-
28
-
29
-
30
-
31
-
32
-
33
-
34
-
35
-
 36
36 -
 37
37 -
 38
38 -
 39
39 -
 40
40 -
 41
41 -
 42
42 -
 43
43 -
 44
44 -
 45
45 -
 46
46 -
 47
47 -
 48
48 -
 49
49 -
 50
50 -
 51
51 -
 52
52 -
 53
53 -
 54
54 -
 55
55 -
 56
56 -
57
-
58
-
59
-
60
-
61
-
62
-
63
-
64
-
65
-
66
-
67
-
68
-
69
-
70
-
71
-
72
-
73
-
74
-
75
-
76
-
77
-
78
-
79
-
80
-
81
-
82
-
83
-
84
-
85
-
86
-
87
-
88
-
89
-
90
-
91
-
92
-
93
-
94
-
95
-
96
-
97
-
98
-
99
-
100
-
101
-
102
-
103
-
104
-
105
-
106
-
107
-
108
-
109
-
110
-
111
-
112
-
113
-
114
-
115
-
116
-
117
-
118
-
119
-
120
-
121
-
122
-
123
-
124
-
125
-
126
-
127
-
128
-
129
-
130
-
131
-
132
-
133
-
134
-
135
-
136
-
137
-
138
-
139
-
140
-
141
-
142
-
143
-
144
-
145
-
146
-
147
-
148
-
149
-
150
-
151
-
152
-
153
-
154
-
155
-
156
-
157
-
158
-
159
-
160
-
161
-
162
-
163
-
164
-
165
-
166
 |
 |

issued long-term debt, the payment of common stock dividends, the payment of dividends on the preferred shares, the payment of debt
and equity issuance costs, and the repurchase of its common stock by RGA.
Net cash used in investing activities decreased by $3.7 billion to $18.9 billion for the year ended December 31, 2006 from $22.6 billion
for the comparable 2005 period. Net cash used in investing activities in the prior year included cash used to acquire Travelers of
$11.0 billion, less cash acquired of $0.9 billion for a net total cash paid of $10.1 billion, which was funded by $6.8 billion in securities
issuances and $4.2 billion of cash provided by operations and the sale of invested assets. During the current year, cash available for
investment as a result of cash collateral received in connection with the securities lending program increased by $7.2 billion. Cash
available from operations and available for investment decreased by $1.4 billion. Cash available for the purchase of invested assets
increased by $4.3 billion as a result of the increase in securities lending activities of $7.2 billion as well as a decrease in the cash required
for acquisitions of $4.2 billion, offset by the decrease in issuance of preferred stock, junior subordinated debt securities, and long-term
debt aggregating $5.7 billion as well as the decrease in cash flow from operations of $1.4 billion. Cash available for investing activities was
used to increase purchases of fixed maturity securities, other invested assets, and short-term investments, as well as increase the
origination of mortgage and consumer loans and decrease net sales of real estate and real estate joint ventures and equity securities.
Net cash used in investing activities was $22.6 billion and $14.4 billion for the years ended December 31, 2005 and 2004, respectively.
The $8.2 billion increase in net cash used in investing activities in 2005 over the comparable 2004 period was primarily due to the
acquisition of Travelers and CitiStreet Associates, the increase in net purchases of fixed maturity securities and an increase in the
origination of mortgage and consumer loans, primarily in commercial loans, as compared to the 2004 period. This was partially offset by an
increase in repayments of mortgage and consumer loans, an increase in sales of equity real estate and a decrease in the cash used for
short-term investments. In addition, the 2005 period includes proceeds associated with the sale of SSRM and MetLife Indonesia.
The Holding Company
Capital
Restrictions and Limitations on Bank Holding Companies and Financial Holding Companies — Capital. The Holding Company and its
insured depository institution subsidiary, MetLife Bank, are subject to risk-based and leverage capital guidelines issued by the federal
banking regulatory agencies for banks and financial holding companies. The federal banking regulatory agencies are required by law to
take specific prompt corrective actions with respect to institutions that do not meet minimum capital standards. As of their most recently
filed reports with the federal banking regulatory agencies, MetLife, Inc. and MetLife Bank met the minimum capital standards as per federal
banking regulatory agencies with all of MetLife Bank’s risk-based and leverage capital ratios meeting the federal banking regulatory
agencies’ “well capitalized” standards and all of MetLife, Inc.’s risk-based and leverage capital ratios meeting the “adequately capitalized”
standards.
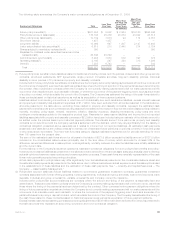
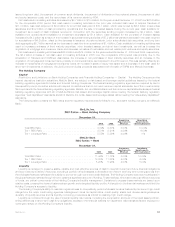
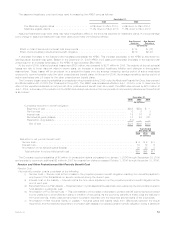
The following table contains the RBC ratios and the regulatory requirements for MetLife, Inc., as a bank holding company, and MetLife
Bank:
MetLife, Inc.
RBC Ratios — Bank Holding Company
2006 2005
Regulatory
Requirements
Minimum
Regulatory
Requirements
“Well Capitalized”
December 31,
TotalRBCRatio.................................. 9.89% 9.57% 8.00% 10.00%
Tier1RBCRatio................................. 9.51% 9.21% 4.00% 6.00%
Tier1LeverageRatio.............................. 5.55% 5.39% 4.00% n/a
MetLife Bank
RBC Ratios — Bank
2006 2005
Regulatory
Requirements
Minimum
Regulatory
Requirements
“Well Capitalized”
December 31,
TotalRBCRatio................................ 11.44% 11.78% 8.00% 10.00%
Tier1RBCRatio ............................... 10.88% 11.22% 4.00% 6.00%
Tier1LeverageRatio ............................ 5.98% 5.96% 4.00% 5.00%
Liquidity
Liquidity is managed to preserve stable, reliable and cost-effective sources of cash to meet all current and future financial obligations
and is provided by a variety of sources, including a portfolio of liquid assets, a diversified mix of short- and long-term funding sources from
the wholesale financial markets and the ability to borrow through committed credit facilities. The Holding Company is an active participant in
the global financial markets through which it obtains a significant amount of funding. These markets, which serve as cost-effective sources
of funds, are critical components of the Holding Company’s liquidity management. Decisions to access these markets are based upon
relative costs, prospective views of balance sheet growth and a targeted liquidity profile. A disruption in the financial markets could limit the
Holding Company’s access to liquidity.
The Holding Company’s ability to maintain regular access to competitively priced wholesale funds is fostered by its current high credit
ratings from the major credit rating agencies. Management views its capital ratios, credit quality, stable and diverse earnings streams,
diversity of liquidity sources and its liquidity monitoring procedures as critical to retaining high credit ratings.
Liquidity is monitored through the use of internal liquidity risk metrics, including the composition and level of the liquid asset portfolio,
timing differences in short-term cash flow obligations, access to the financial markets for capital and debt transactions and exposure to
contingent draws on the Holding Company’s liquidity.
43MetLife, Inc.