MetLife 2006 Annual Report Download - page 24
Download and view the complete annual report
Please find page 24 of the 2006 MetLife annual report below. You can navigate through the pages in the report by either clicking on the pages listed below, or by using the keyword search tool below to find specific information within the annual report.-
 1
1 -
2
-
3
-
4
-
5
-
6
-
7
-
8
-
9
-
10
-
11
-
12
-
13
-
 14
14 -
 15
15 -
 16
16 -
 17
17 -
 18
18 -
 19
19 -
 20
20 -
 21
21 -
 22
22 -
 23
23 -
 24
24 -
 25
25 -
 26
26 -
 27
27 -
 28
28 -
 29
29 -
 30
30 -
 31
31 -
 32
32 -
 33
33 -
 34
34 -
35
-
36
-
37
-
38
-
39
-
40
-
41
-
42
-
43
-
44
-
45
-
46
-
47
-
48
-
49
-
50
-
51
-
52
-
53
-
54
-
55
-
56
-
57
-
58
-
59
-
60
-
61
-
62
-
63
-
64
-
65
-
66
-
67
-
68
-
69
-
70
-
71
-
72
-
73
-
74
-
75
-
76
-
77
-
78
-
79
-
80
-
81
-
82
-
83
-
84
-
85
-
86
-
87
-
88
-
89
-
90
-
91
-
92
-
93
-
94
-
95
-
96
-
97
-
98
-
99
-
100
-
101
-
102
-
103
-
104
-
105
-
106
-
107
-
108
-
109
-
110
-
111
-
112
-
113
-
114
-
115
-
116
-
117
-
118
-
119
-
120
-
121
-
122
-
123
-
124
-
125
-
126
-
127
-
128
-
129
-
130
-
131
-
132
-
133
-
134
-
135
-
136
-
137
-
138
-
139
-
140
-
141
-
142
-
143
-
144
-
145
-
146
-
147
-
148
-
149
-
150
-
151
-
152
-
153
-
154
-
155
-
156
-
157
-
158
-
159
-
160
-
161
-
162
-
163
-
164
-
165
-
166
 |
 |
Non-medical health & other’s favorable underwriting results were primarily due to improvements in the IDI and dental businesses. The IDI
results included certain reserve refinements in the prior year. Partially offsetting these increases was a decrease in the AD&D and disability
businesses. Disability’s results include the benefit of prior and current year reserve refinements.
Retirement & savings’ underwriting results were favorable with mixed underwriting across several products. Underwriting results are
generally the difference between the portion of premium and fee income intended to cover mortality, morbidity, or other insurance costs
less claims incurred, and the change in insurance-related liabilities. Underwriting results are significantly influenced by mortality, morbidity,
or other insurance-related experience trends and the reinsurance activity related to certain blocks of business.
The remaining increase in operating expenses more than offset the remaining increase in premiums, fees and other revenues.
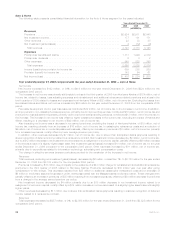
Revenues
Total revenues, excluding net investment gains (losses), increased by $1,839 million, or 10%, to $20,594 million for the year ended
December 31, 2006 from $18,755 million for the comparable 2005 period. The acquisition of Travelers contributed $797 million during the
first six months of 2006 to the year over year increase. Excluding the impact of the Travelers acquisition, such revenues increased by
$1,042 million, or 6%, from the comparable 2005 period. This increase was comprised of higher net investment income of $584 million and
growth in premiums, fees and other revenues of $458 million.
Net investment income increased by $584 million of which management attributes $464 million to growth in the average asset base
driven by business growth throughout 2005 and 2006, particularly in the GIC and structured settlement businesses and $120 million to an
increase in yields. The increase in yields is primarily attributable to higher yields on fixed maturity securities, an increase in short-term rates
and higher returns on joint ventures. These increases were partially offset by a decline in securities lending results and commercial
mortgage prepayment fees.
The increase of $458 million in premiums, fees and other revenues was largely due to increases in the non-medical health & other
business of $408 million, primarily due to growth in the dental, disability and AD&D products of $255 million. In addition, continued growth
in the LTC and IDI businesses contributed $117 million and $25 million, respectively. Group life increased by $296 million, which
management primarily attributes to the impact of sales and favorable persistency largely in term life business, which includes a significant
increase in premiums from two large customers. Partially offsetting these increases was a decline in retirement & savings’ premiums, fees
and other revenues of $246 million, resulting primarily from a decline of $320 million in structured settlements, predominantly due to the
impact of lower sales. This decline was partially offset by a $83 million increase in MTF premiums. Premiums, fees and other revenues from
retirement & savings products are significantly influenced by large transactions and, as a result, can fluctuate from period to period.
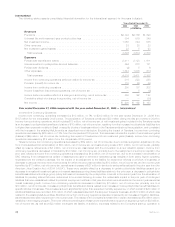
Expenses
Total expenses increased by $1,616 million, or 10%, to $18,274 million for the year ended December 31, 2006 from $16,658 million for
the comparable 2005 period. The acquisition of Travelers contributed $551 million during the first six months of 2006 to the year over year
increase. Excluding the impact of the Travelers acquisition, total expenses increased $1,065 million, or 6%, from the comparable 2005
period.
The increase in expenses was attributable to higher interest credited to PABs of $621 million, policyholder benefits and claims of
$366 million and operating expenses of $79 million.
Management attributes the increase of $621 million in interest credited to PABs to $433 million from an increase in average crediting
rates, which was largely due to the impact of higher short-term rates in the current year period and $188 million solely from growth in the
average PAB, primarily resulting from GICs within the retirement & savings business.
The increases in policyholder benefits and claims of $366 million included a $27 million increase related to net investment gains
(losses). Excluding the increase related to net investment gains (losses), policyholder benefits and claims increased by $339 million. Non-
medical health & other’s policyholder benefits and claims increased by $306 million, predominantly due to the aforementioned growth in
business, as well as unfavorable morbidity in disability and unfavorable claim experience in AD&D. Partially offsetting these increases was
favorable claim and morbidity experience in IDI, as well as the impact of an establishment of a $25 million liability for future losses in the
prior year. In addition, favorable claim experience in the current year reduced dental policyholder benefits and claims. Additionally, disability
business included a $22 million benefit which resulted from reserve refinements in the current year. The year over year variance in disability
also includes the impact of an $18 million loss related to Hurricane Katrina in the prior year. Group life’s policyholder benefits and claims
increased by $238 million, largely due to the aforementioned growth in the business, partially offset by favorable underwriting results,
particularly in the term life business. Term life included a benefit of $16 million due to reserve refinements in the current year. Partially
offsetting the increase was a retirement & savings’ policyholder benefits and claims decrease of $205 million, predominantly due to the
aforementioned decrease in revenues, partially offset by higher FAS 60 interest credits recorded in policyholder benefits and claims due to
growth in structured settlements and MTF.
The increase in other expenses of $79 million was primarily due to an increase in the current year of $60 million in non-deferrable
volume related expenses and corporate support expenses. Non-deferrable volume related expenses include those expenses associated
with information technology, direct departmental spending and commission expenses. Corporate support expenses include advertising,
corporate overhead and consulting fees. Also contributing to the increase was $26 million associated with costs related to the sale of
certain small market recordkeeping businesses, $23 million of non-deferrable LTC commission expense, $24 million related to costs
associated with a previously announced regulatory settlement and $11 million related to stock-based compensation. Partially offsetting
these increases were benefits due to prior year charges of $43 million in Travelers-related integration costs, principally incentive accruals
and $22 million related to an adjustment of DAC for certain LTC products.
Year ended December 31, 2005 compared with the year ended December 31, 2004 — Institutional
Income from Continuing Operations
Income from continuing operations increased by $89 million, or 7%, to $1,388 million for the year ended December 31, 2005 from
$1,299 million for the comparable 2004 period. The acquisition of Travelers accounted for $73 million of this increase, which includes
$57 million, net of income tax, of net investment losses. Excluding the impact of the Travelers acquisition, income from continuing
operations increased by $16 million, or 1%, from the comparable 2004 period.
21MetLife, Inc.