MetLife 2006 Annual Report Download - page 21
Download and view the complete annual report
Please find page 21 of the 2006 MetLife annual report below. You can navigate through the pages in the report by either clicking on the pages listed below, or by using the keyword search tool below to find specific information within the annual report.-
 1
1 -
2
-
3
-
4
-
5
-
6
-
7
-
8
-
9
-
10
-
 11
11 -
 12
12 -
 13
13 -
 14
14 -
 15
15 -
 16
16 -
 17
17 -
 18
18 -
 19
19 -
 20
20 -
 21
21 -
 22
22 -
 23
23 -
 24
24 -
 25
25 -
 26
26 -
 27
27 -
 28
28 -
 29
29 -
 30
30 -
 31
31 -
32
-
33
-
34
-
35
-
36
-
37
-
38
-
39
-
40
-
41
-
42
-
43
-
44
-
45
-
46
-
47
-
48
-
49
-
50
-
51
-
52
-
53
-
54
-
55
-
56
-
57
-
58
-
59
-
60
-
61
-
62
-
63
-
64
-
65
-
66
-
67
-
68
-
69
-
70
-
71
-
72
-
73
-
74
-
75
-
76
-
77
-
78
-
79
-
80
-
81
-
82
-
83
-
84
-
85
-
86
-
87
-
88
-
89
-
90
-
91
-
92
-
93
-
94
-
95
-
96
-
97
-
98
-
99
-
100
-
101
-
102
-
103
-
104
-
105
-
106
-
107
-
108
-
109
-
110
-
111
-
112
-
113
-
114
-
115
-
116
-
117
-
118
-
119
-
120
-
121
-
122
-
123
-
124
-
125
-
126
-
127
-
128
-
129
-
130
-
131
-
132
-
133
-
134
-
135
-
136
-
137
-
138
-
139
-
140
-
141
-
142
-
143
-
144
-
145
-
146
-
147
-
148
-
149
-
150
-
151
-
152
-
153
-
154
-
155
-
156
-
157
-
158
-
159
-
160
-
161
-
162
-
163
-
164
-
165
-
166
 |
 |
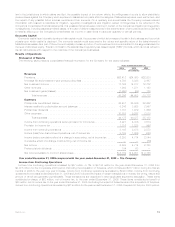
and favorable persistency in group life and higher structured settlement sales and pension close-outs in retirement & savings. The
Reinsurance segment contributed $523 million, or 19%, to the Company’s year over year increase in premiums, fees and other revenues.
This growth is primarily attributable to new premiums from facultative and automatic treaties and renewal premiums on existing blocks of
business, as well as favorable exchange rate movements. The International segment contributed $452 million, or 17%, to the year over year
increase primarily due to business growth through increased sales and renewal business in Mexico, South Korea, Brazil, and Taiwan, as
well as changes in foreign currency rates. In addition, Chile’s premiums, fees and other revenues increased due to the new bank
distribution channel established in 2005. The Individual segment contributed $446 million, or 17%, to the year over year increase primarily
due to higher fee income from variable annuity and universal life products, active marketing of income annuity products and growth in the
business in traditional life products. The growth in traditional products more than offset the decline in premiums in the Company’s closed
block business as this business continues to run-off. Corporate & Other contributed $37 million, or 1%, to the year over year increase,
primarily due to intersegment eliminations. The increase in premiums, fees and other revenues were partially offset by a decrease in the
Auto & Home segment of $39 million, or 1%. This decrease is primarily attributable to reinstatement and additional reinsurance-related
premiums due to Hurricane Katrina.
Interest Margin
Interest margin, which represents the difference between interest earned and interest credited to PABs, increased in the Institutional
and Individual segments for the year ended December 31, 2005 as compared to the prior year. Interest earned approximates net
investment income on investable assets attributed to the segment with minor adjustments related to the consolidation of certain separate
accounts and other minor non-policyholder elements. Interest credited is the amount attributed to insurance products, recorded in
policyholder benefits, and the amount credited to PABs for investment-type products, recorded in interest credited to PABs. Interest
credited on insurance products reflects the current period impact of the interest rate assumptions established at issuance or acquisition.
Interest credited to PABs is subject to contractual terms, including some minimum guarantees. This tends to move gradually over time to
reflect market interest rate movements and may reflect actions by management to respond to competitive pressures and, therefore,
generally does not introduce volatility in expense.
Underwriting
Underwriting results were favorable within the life products in the Individual and Institutional segments, while underwriting results were
unfavorable in the Reinsurance segment and in the retirement & savings and non medical health & other products within the Institutional
segment. Underwriting results are generally the difference between the portion of premium and fee income intended to cover mortality,
morbidity or other insurance costs, less claims incurred, and the change in insurance-related liabilities. Underwriting results are
significantly influenced by mortality, morbidity or other insurance-related experience trends and the reinsurance activity related to certain
blocks of business and, as a result, can fluctuate from period to period. Underwriting results, excluding catastrophes, in the Auto & Home
segment were favorable for the year ended December 31, 2005, as the combined ratio, excluding catastrophes and before the
reinstatement premiums and other reinsurance related premium adjustments due to Hurricane Katrina, decreased to 86.7% from
90.4% in the prior year period. Offsetting the improved non-catastrophe ratios in the Auto & Home segment was an increase in
catastrophes primarily due to Hurricanes Katrina and Wilma. Underwriting results in the International segment increased commensurate
with the growth in the business as discussed above.
Other Expenses
Other expenses increased by $1,454 million, or 19%, to $9,267 million for the year ended December 31, 2005 from $7,813 million for
the comparable 2004 period. The current period includes $618 million of other expenses related to the acquisition of Travelers. Excluding
the acquisition of Travelers, other expenses increased by $836 million, or 11%. The year ended December 31, 2005 includes a $28 million
benefit associated with the reduction of a previously established real estate transfer tax liability related to Metropolitan Life’s demutualiza-
tion in 2000. The year ended December 31, 2004 reflects a $49 million reduction of a premium tax liability and a $22 million reduction of a
liability for interest associated with the resolution of all issues relating to the Internal Revenue Service’s audit of Metropolitan Life’s and its
subsidiaries’ tax returns for the years 1997-1999. These decreases were partially offset by a $50 million contribution of appreciated stock
to the MetLife Foundation. Excluding the impact of these transactions, other expenses increased by $843 million, or 11%, from the
comparable 2004 period. Corporate & Other contributed $412 million, or 49%, to the year over year variance primarily due to higher interest
expense, integration costs associated with the Travelers acquisition, growth in interest credited to bank holder deposits at MetLife Bank
and legal-related liabilities, partially offset by a reduction in corporate support expenses. The Institutional segment contributed $178 million,
or 21%, to the year over year variance primarily due to higher non-deferrable volume-related expenses associated with general business
growth, corporate support expenses, higher expenses related to additional Travelers incentive accruals, as well as an adjustment recorded
on DAC associated with certain LTC products in 2005. In addition, $174 million, or 21%, of this increase is primarily attributable to higher
amortization of DAC, changes in foreign currency rates, business growth commensurate with the increase in revenues discussed above, a
decrease in the payroll tax liability and an accrual for an early retirement program in the International segment. Other expenses in the
International segment also increased due to higher consultant fees for growth initiative projects, an increase in compensation and incentive
expenses, as well as higher costs for legal, marketing and other corporate allocated expenses. The Reinsurance segment also contributed
$34 million, or 4%, to the increase in other expenses primarily due to an increase in the amortization of DAC. The Auto & Home segment
contributed $33 million, or 4%, to this increase primarily due to increased information technology, advertising and incentive and other
compensation costs. In addition, the Individual segment contributed $12 million, or 1%, to the year over year increase primarily due to
higher corporate incentive expenses and general spending, partially offset by the revision of prior period estimates for certain expense,
premium tax and policyholder liabilities, as well as certain asset write-offs in the prior year and lower DAC amortization.
Net Investment Gains (Losses)
Net investment gains (losses) decreased by $268 million, or 153%, to a loss of $93 million for the year ended December 31, 2005 from
a net investment gain of $175 million for the comparable 2004 period. The current year includes $208 million of net investment losses
related to the acquisition of Travelers. Excluding the acquisition of Travelers, net investment gains (losses) decreased by $60 million, or
34%. This decrease is primarily due to losses on fixed maturity security sales resulting from continued portfolio repositioning in the 2005
period. Significantly offsetting these reductions is an increase in gains from the mark-to-market on derivatives in 2005. The derivative gains
18 MetLife, Inc.