MetLife 2006 Annual Report Download - page 37
Download and view the complete annual report
Please find page 37 of the 2006 MetLife annual report below. You can navigate through the pages in the report by either clicking on the pages listed below, or by using the keyword search tool below to find specific information within the annual report.-
 1
1 -
2
-
3
-
4
-
5
-
6
-
7
-
8
-
9
-
10
-
11
-
12
-
13
-
14
-
15
-
16
-
17
-
18
-
19
-
20
-
21
-
22
-
23
-
24
-
25
-
26
-
 27
27 -
 28
28 -
 29
29 -
 30
30 -
 31
31 -
 32
32 -
 33
33 -
 34
34 -
 35
35 -
 36
36 -
 37
37 -
 38
38 -
 39
39 -
 40
40 -
 41
41 -
 42
42 -
 43
43 -
 44
44 -
 45
45 -
 46
46 -
 47
47 -
48
-
49
-
50
-
51
-
52
-
53
-
54
-
55
-
56
-
57
-
58
-
59
-
60
-
61
-
62
-
63
-
64
-
65
-
66
-
67
-
68
-
69
-
70
-
71
-
72
-
73
-
74
-
75
-
76
-
77
-
78
-
79
-
80
-
81
-
82
-
83
-
84
-
85
-
86
-
87
-
88
-
89
-
90
-
91
-
92
-
93
-
94
-
95
-
96
-
97
-
98
-
99
-
100
-
101
-
102
-
103
-
104
-
105
-
106
-
107
-
108
-
109
-
110
-
111
-
112
-
113
-
114
-
115
-
116
-
117
-
118
-
119
-
120
-
121
-
122
-
123
-
124
-
125
-
126
-
127
-
128
-
129
-
130
-
131
-
132
-
133
-
134
-
135
-
136
-
137
-
138
-
139
-
140
-
141
-
142
-
143
-
144
-
145
-
146
-
147
-
148
-
149
-
150
-
151
-
152
-
153
-
154
-
155
-
156
-
157
-
158
-
159
-
160
-
161
-
162
-
163
-
164
-
165
-
166
 |
 |

Corporate & Other
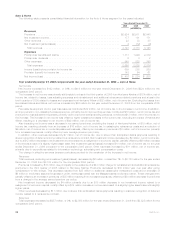
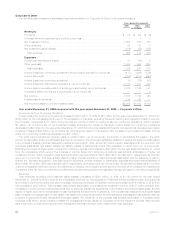
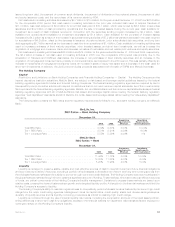
The following table presents consolidated financial information for Corporate & Other for the years indicated:
2006 2005 2004
Years Ended December 31,
(In millions)
Revenues
Premiums..................................................... $ 35 $ 22 $ (9)
Universallifeandinvestment-typeproductpolicyfees ........................ — 1 2
Netinvestmentincome ............................................ 1,054 709 385
Otherrevenues ................................................. 34 30 8
Netinvestmentgains(losses) ........................................ (154) (48) (152)
Totalrevenues................................................. 969 714 234
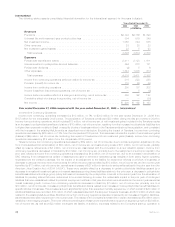
Expenses
Policyholderbenefitsandclaims ...................................... 37 (15) 5
Otherexpenses................................................. 1,349 955 605
Totalexpenses ................................................ 1,386 940 610
Income (loss) from continuing operations before provision (benefit) for income tax . . . . . . (417) (226) (376)
Incometaxbenefit ............................................... (416) (211) (294)
Income(loss)fromcontinuingoperations................................. (1) (15) (82)
Income(loss)fromdiscontinuedoperations,netofincometax................... 3,129 1,161 223
Income before cumulative effect of a change in accounting, net of income tax . . . . . . . . . 3,128 1,146 141
Cumulativeeffectofachangeinaccounting,netofincometax .................. — — 4
Netincome.................................................... 3,128 1,146 145
Preferredstockdividends........................................... 134 63 —
Netincomeavailabletocommonshareholders ............................. $2,994 $1,083 $145
Year ended December 31, 2006 compared with the year ended December 31, 2005 — Corporate & Other
Income (Loss) from Continuing Operations
Income (loss) from continuing operations increased by $14 million, or 93%, to ($1) million for the year ended December 31, 2006 from
($15) million for the comparable 2005 period. The acquisition of Travelers, excluding Travelers financing and integration costs incurred by
the Company, contributed $111 million during the first six months of 2006 to income (loss) from continuing operations, which included
$3 million, net of income tax, of net investment losses. Excluding the impact of Travelers, income (loss) from continuing operations
decreased by $97 million for the year ended December 31, 2006 from the comparable 2005 period. Included in this decrease were higher
investment losses of $66 million, net of income tax. Excluding the impact of Travelers and the increase of net investment losses, income
(loss) from continuing operations decreased by $31 million.
The 2006 period includes an expense related to a $23 million, net of income tax, contribution to the MetLife Foundation. The 2005
period included a $30 million benefit associated with the reduction of a previously established liability for settlement death benefits related
to the Company’s sales practices class action settlement recorded in 1999, and an $18 million benefit, associated with the reduction of a
previously established real estate transfer tax liability related to Metropolitan Life’s demutualization in 2000, both net of income tax.
Excluding the impact of these items, income from continuing operations increased by $40 million for the year ended December 31, 2006
from the comparable 2005 period. The increase in income (loss) from continuing operations was primarily attributable to higher net
investment income, lower integration costs and higher other revenues of $102 million, $62 million, and $4 million, respectively, all of which
were net of income tax. This was partially offset by higher interest expense on debt (principally associated with the issuance of debt to
finance the Travelers acquisition), corporate support expenses, interest credited to bankholder deposits and legal-related liabilities of
$125 million, $70 million, $55 million and $5 million, respectively, all of which were net of income tax. Tax benefits increased by $113 million
over the comparable 2005 period due to the difference of finalizing the Company’s 2005 tax return in 2006 when compared to finalizing the
Company’s 2004 tax return in 2005 and the difference between the actual and the estimated tax rate allocated to the various segments.
Revenues
Total revenues, excluding net investment gains (losses), increased by $361 million, or 47%, to $1,123 million for the year ended
December 31, 2006 from $762 million for the comparable 2005 period. The acquisition of Travelers contributed $200 million during the first
six months of 2006 to the period over period increase. Excluding the impact of Travelers, revenues increased by $161 million, or 21%, from
the comparable 2005 period. This increase was primarily attributable to increased net investment income of $157 million primarily from
increases in income on fixed maturity securities due to improved yields from lengthening of the duration and a higher asset base, and the
impact of higher short-term interest rates on cash equivalents and short term investments. The increase also resulted from a higher asset
base invested in mortgage loans on real estate, real estate joint ventures, and other limited partnership interests and was partially offset by
a decline in securities lending results and leveraged leases. The remainder of the increase was primarily attributable to increased other
revenues of $4 million, which primarily consisted of increased surrender values on corporate owned life insurance policies. Also included
as a component of total revenues were the intersegment eliminations which were offset within total expenses.
34 MetLife, Inc.