MetLife 2006 Annual Report Download - page 145
Download and view the complete annual report
Please find page 145 of the 2006 MetLife annual report below. You can navigate through the pages in the report by either clicking on the pages listed below, or by using the keyword search tool below to find specific information within the annual report.-
 1
1 -
2
-
3
-
4
-
5
-
6
-
7
-
8
-
9
-
10
-
11
-
12
-
13
-
14
-
15
-
16
-
17
-
18
-
19
-
20
-
21
-
22
-
23
-
24
-
25
-
26
-
27
-
28
-
29
-
30
-
31
-
32
-
33
-
34
-
35
-
36
-
37
-
38
-
39
-
40
-
41
-
42
-
43
-
44
-
45
-
46
-
47
-
48
-
49
-
50
-
51
-
52
-
53
-
54
-
55
-
56
-
57
-
58
-
59
-
60
-
61
-
62
-
63
-
64
-
65
-
66
-
67
-
68
-
69
-
70
-
71
-
72
-
73
-
74
-
75
-
76
-
77
-
78
-
79
-
80
-
81
-
82
-
83
-
84
-
85
-
86
-
87
-
88
-
89
-
90
-
91
-
92
-
93
-
94
-
95
-
96
-
97
-
98
-
99
-
100
-
101
-
102
-
103
-
104
-
105
-
106
-
107
-
108
-
109
-
110
-
111
-
112
-
113
-
114
-
115
-
116
-
117
-
118
-
119
-
120
-
121
-
122
-
123
-
124
-
125
-
126
-
127
-
128
-
129
-
130
-
131
-
132
-
133
-
134
-
 135
135 -
 136
136 -
 137
137 -
 138
138 -
 139
139 -
 140
140 -
 141
141 -
 142
142 -
 143
143 -
 144
144 -
 145
145 -
 146
146 -
 147
147 -
 148
148 -
 149
149 -
 150
150 -
 151
151 -
 152
152 -
 153
153 -
 154
154 -
 155
155 -
156
-
157
-
158
-
159
-
160
-
161
-
162
-
163
-
164
-
165
-
166
 |
 |

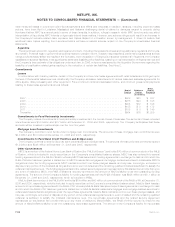
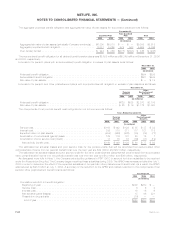
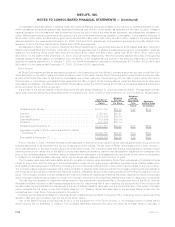
The aggregate projected benefit obligation and aggregate fair value of plan assets for the pension plans were as follows:
2006 2005 2006 2005 2006 2005
Qualified Plan Non-Qualified
Plan Total
December 31,
(In millions)
Aggregate fair value of plan assets (principally Company contracts) . . $6,305 $5,518 $ — $ — $6,305 $5,518
Aggregate projected benefit obligation . . . . . . . . . . . . . . . . . . . . . 5,381 5,258 578 508 5,959 5,766
Over (under) funded . . . . . . . . . . . . . . . . . . . . . . . . . . . . . . . . . $ 924 $ 260 $(578) $(508) $ 346 $ (248)
The accumulated benefit obligation for all defined benefit pension plans was $5,505 million and $5,349 million at December 31, 2006
and 2005, respectively.
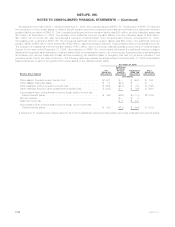
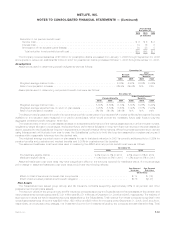
Information for pension plans with an accumulated benefit obligation in excess of plan assets is as follows:
2006 2005
December 31,
(In millions)
Projectedbenefitobligation........................................................ $594 $538
Accumulatedbenefitobligation ..................................................... $501 $449
Fairvalueofplanassets.......................................................... $ — $ 19
Information for pension and other postretirement plans with a projected benefit obligation in excess of plan assets is as follows:
2006 2005 2006 2005
Pension
Benefits
Other
Postretirement
Benefits
December 31,
(In millions)
Projectedbenefitobligation .......................................... $623 $538 $2,073 $2,176
Fairvalueofplanassets ............................................ $ 25 $ 19 $1,172 $1,093
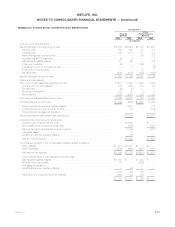
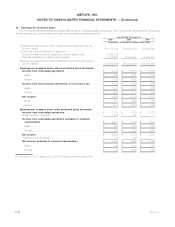
The components of net periodic benefit cost recognized in net income were as follows:
2006 2005 2004 2006 2005 2004
Pension
Benefits
Other
Postretirement
Benefits
Years Ended December 31,
(In millions)
Servicecost........................................... $163 $142 $129 $ 35 $ 37 $ 32
Interestcost........................................... 335 318 311 117 121 119
Expectedreturnonplanassets .............................. (454) (446) (428) (79) (79) (77)
Amortizationofnetactuarial(gains)losses ....................... 125 116 101 23 15 7
Amortizationofpriorservicecost(credit) ........................ 11 16 16 (36) (17) (19)
Netperiodicbenefitcost ................................. $180 $146 $129 $ 60 $ 77 $ 62
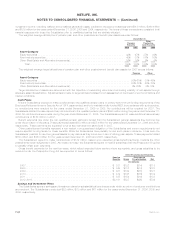
The estimated net actuarial losses and prior service cost for the pension plans that will be amortized from accumulated other
comprehensive income into net periodic benefit cost over the next year are $54 million and $12 million, respectively.
The estimated net actuarial losses and prior service credit for the other postretirement plans that will be amortized from accumulated
other comprehensive income into net periodic benefit cost over the next year are $14 million and $36 million, respectively.
As discussed more fully in Note 1, the Company adopted the guidance in FSP 106-2 to account for future subsidies to be received
under the Prescription Drug Act. The Company began receiving these subsidies during 2006. The APBO was remeasured effective July 1,
2004 in order to determine the effect of the expected subsidies on net periodic other postretirement benefit cost. As a result, the APBO
was reduced by $213 million at July 1, 2004. A summary of the reduction to the APBO and related reduction to the components of net
periodic other postretirement benefit cost is as follows:
2006 2005 2004
December 31,
(In millions)
Cumulative reduction in benefit obligation:
Beginningofyear ....................................................... $298 $230 $ —
Servicecost........................................................... 6 6 3
Interestcost........................................................... 19 16 6
Netactuarialgains(losses) ................................................. 15 46 221
Prescriptiondrugsubsidy .................................................. (10) — —
Endofyear.......................................................... $328 $298 $230
F-62 MetLife, Inc.
METLIFE, INC.
NOTES TO CONSOLIDATED FINANCIAL STATEMENTS — (Continued)