Chrysler 2012 Annual Report Download - page 95
Download and view the complete annual report
Please find page 95 of the 2012 Chrysler annual report below. You can navigate through the pages in the report by either clicking on the pages listed below, or by using the keyword search tool below to find specific information within the annual report.-
 1
1 -
2
-
3
-
4
-
5
-
6
-
7
-
8
-
9
-
10
-
11
-
12
-
13
-
14
-
15
-
16
-
17
-
18
-
19
-
20
-
21
-
22
-
23
-
24
-
25
-
26
-
27
-
28
-
29
-
30
-
31
-
32
-
33
-
34
-
35
-
36
-
37
-
38
-
39
-
40
-
41
-
42
-
43
-
44
-
45
-
46
-
47
-
48
-
49
-
50
-
51
-
52
-
53
-
54
-
55
-
56
-
57
-
58
-
59
-
60
-
61
-
62
-
63
-
64
-
65
-
66
-
67
-
68
-
69
-
70
-
71
-
72
-
73
-
74
-
75
-
76
-
77
-
78
-
79
-
80
-
81
-
82
-
83
-
84
-
 85
85 -
 86
86 -
 87
87 -
 88
88 -
 89
89 -
 90
90 -
 91
91 -
 92
92 -
 93
93 -
 94
94 -
 95
95 -
 96
96 -
 97
97 -
 98
98 -
 99
99 -
 100
100 -
 101
101 -
 102
102 -
 103
103 -
 104
104 -
 105
105 -
106
-
107
-
108
-
109
-
110
-
111
-
112
-
113
-
114
-
115
-
116
-
117
-
118
-
119
-
120
-
121
-
122
-
123
-
124
-
125
-
126
-
127
-
128
-
129
-
130
-
131
-
132
-
133
-
134
-
135
-
136
-
137
-
138
-
139
-
140
-
141
-
142
-
143
-
144
-
145
-
146
-
147
-
148
-
149
-
150
-
151
-
152
-
153
-
154
-
155
-
156
-
157
-
158
-
159
-
160
-
161
-
162
-
163
-
164
-
165
-
166
-
167
-
168
-
169
-
170
-
171
-
172
-
173
-
174
-
175
-
176
-
177
-
178
-
179
-
180
-
181
-
182
-
183
-
184
-
185
-
186
-
187
-
188
-
189
-
190
-
191
-
192
-
193
-
194
-
195
-
196
-
197
-
198
-
199
-
200
-
201
-
202
-
203
-
204
-
205
-
206
-
207
-
208
-
209
-
210
-
211
-
212
-
213
-
214
-
215
-
216
-
217
-
218
-
219
-
220
-
221
-
222
-
223
-
224
-
225
-
226
-
227
-
228
-
229
-
230
-
231
-
232
-
233
-
234
-
235
-
236
-
237
-
238
-
239
-
240
-
241
-
242
-
243
-
244
-
245
-
246
-
247
-
248
-
249
-
250
-
251
-
252
-
253
-
254
-
255
-
256
-
257
-
258
-
259
-
260
-
261
-
262
-
263
-
264
-
265
-
266
-
267
-
268
-
269
-
270
-
271
-
272
-
273
-
274
-
275
-
276
-
277
-
278
-
279
-
280
-
281
-
282
-
283
-
284
-
285
-
286
-
287
-
288
-
289
-
290
-
291
-
292
-
293
-
294
-
295
-
296
-
297
-
298
-
299
-
300
-
301
-
302
-
303
-
304
-
305
-
306
-
307
-
308
-
309
-
310
-
311
-
312
-
313
-
314
-
315
-
316
-
317
-
318
-
319
-
320
-
321
-
322
-
323
-
324
-
325
-
326
-
327
-
328
-
329
-
330
-
331
-
332
-
333
-
334
-
335
-
336
-
337
-
338
-
339
-
340
-
341
-
342
-
343
-
344
-
345
-
346
 |
 |

94
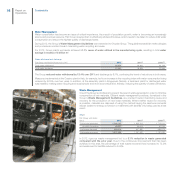
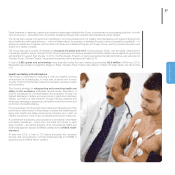
EMPLOYEES AND LOCAL COMMUNITIES
Employees
Human capital is a crucial factor in the Group’s ability to compete, both in terms of maintaining its position among the global leaders in
the automobile sector and also in creating value that is sustainable over the long-term.
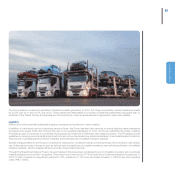
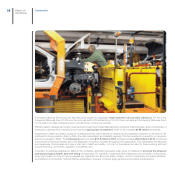
During 2012, the Group operated through companies located in approximately 40 countries and sold its products and services to
customers in more than 140 countries.
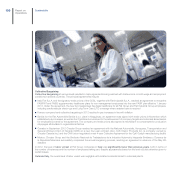
At 31 December 2012, the Group had a total of 214,836 employees, a 9% increase over year-end 2011 attributable in part to changes
in the scope of operations.
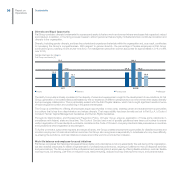
Employees by region and category
Fiat Group worldwide
31 December 2012 Hourly Salaried Professional ManagerTotal
Europe 88,625 57,576 14,526 15,392 1,131
North America 73,713 54,356 8,406 9,959 992
South America 46,949 38,695 5,309 2,794 151
Asia 5,360 2,161 2,364 809 26
Rest of World 189 25 65 97 2
Total 214,836 152,813 30,670 29,051 2,302
Fiat Group worldwide (*)
31 December 2011 Total Hourly Salaried Professional Manager
Europe 87,723 56,765 14,733 15,012 1,213
North America 60,348 43,143 7,485 8,835 885
South America 44,668 36,967 5,155 2,408 138
Asia 4,156 1,833 1,905 401 17
Rest of World 126 24 31 70 1
Total 197,021 138,732 29,309 26,726 2,254
(*) For year-over-year comparability, data for 2011 has been reclassified using a geographic aggregation which differs from the figures presented in the 2011
Sustainability Report.
During the year, the Group hired 33,361 new employees, of which 52.6% were in North America, where there was a significant increase
in production levels. Of those new hires, 71.6% were employed under unlimited term contracts, reflecting the Group’s continued
commitment to the long-term stability of the workforce.
Employee turnover
Fiat Group worldwide 2012
Employees at 31/12/2011 197,021
New Hires 33,361
Departures 22,839
Δ scope of operations 7,293
Employees at 31/12/2012 214,836
Sustainability
Report on
Operations