Chrysler 2012 Annual Report Download - page 161
Download and view the complete annual report
Please find page 161 of the 2012 Chrysler annual report below. You can navigate through the pages in the report by either clicking on the pages listed below, or by using the keyword search tool below to find specific information within the annual report.-
 1
1 -
2
-
3
-
4
-
5
-
6
-
7
-
8
-
9
-
10
-
11
-
12
-
13
-
14
-
15
-
16
-
17
-
18
-
19
-
20
-
21
-
22
-
23
-
24
-
25
-
26
-
27
-
28
-
29
-
30
-
31
-
32
-
33
-
34
-
35
-
36
-
37
-
38
-
39
-
40
-
41
-
42
-
43
-
44
-
45
-
46
-
47
-
48
-
49
-
50
-
51
-
52
-
53
-
54
-
55
-
56
-
57
-
58
-
59
-
60
-
61
-
62
-
63
-
64
-
65
-
66
-
67
-
68
-
69
-
70
-
71
-
72
-
73
-
74
-
75
-
76
-
77
-
78
-
79
-
80
-
81
-
82
-
83
-
84
-
85
-
86
-
87
-
88
-
89
-
90
-
91
-
92
-
93
-
94
-
95
-
96
-
97
-
98
-
99
-
100
-
101
-
102
-
103
-
104
-
105
-
106
-
107
-
108
-
109
-
110
-
111
-
112
-
113
-
114
-
115
-
116
-
117
-
118
-
119
-
120
-
121
-
122
-
123
-
124
-
125
-
126
-
127
-
128
-
129
-
130
-
131
-
132
-
133
-
134
-
135
-
136
-
137
-
138
-
139
-
140
-
141
-
142
-
143
-
144
-
145
-
146
-
147
-
148
-
149
-
150
-
 151
151 -
 152
152 -
 153
153 -
 154
154 -
 155
155 -
 156
156 -
 157
157 -
 158
158 -
 159
159 -
 160
160 -
 161
161 -
 162
162 -
 163
163 -
 164
164 -
 165
165 -
 166
166 -
 167
167 -
 168
168 -
 169
169 -
 170
170 -
 171
171 -
172
-
173
-
174
-
175
-
176
-
177
-
178
-
179
-
180
-
181
-
182
-
183
-
184
-
185
-
186
-
187
-
188
-
189
-
190
-
191
-
192
-
193
-
194
-
195
-
196
-
197
-
198
-
199
-
200
-
201
-
202
-
203
-
204
-
205
-
206
-
207
-
208
-
209
-
210
-
211
-
212
-
213
-
214
-
215
-
216
-
217
-
218
-
219
-
220
-
221
-
222
-
223
-
224
-
225
-
226
-
227
-
228
-
229
-
230
-
231
-
232
-
233
-
234
-
235
-
236
-
237
-
238
-
239
-
240
-
241
-
242
-
243
-
244
-
245
-
246
-
247
-
248
-
249
-
250
-
251
-
252
-
253
-
254
-
255
-
256
-
257
-
258
-
259
-
260
-
261
-
262
-
263
-
264
-
265
-
266
-
267
-
268
-
269
-
270
-
271
-
272
-
273
-
274
-
275
-
276
-
277
-
278
-
279
-
280
-
281
-
282
-
283
-
284
-
285
-
286
-
287
-
288
-
289
-
290
-
291
-
292
-
293
-
294
-
295
-
296
-
297
-
298
-
299
-
300
-
301
-
302
-
303
-
304
-
305
-
306
-
307
-
308
-
309
-
310
-
311
-
312
-
313
-
314
-
315
-
316
-
317
-
318
-
319
-
320
-
321
-
322
-
323
-
324
-
325
-
326
-
327
-
328
-
329
-
330
-
331
-
332
-
333
-
334
-
335
-
336
-
337
-
338
-
339
-
340
-
341
-
342
-
343
-
344
-
345
-
346
 |
 |

Notes
160 Consolidated
Financial
Statements
at 31 December
2012
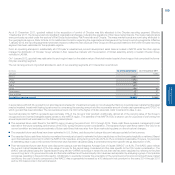
In addition to the analysis described above, the Group also performed a sensitivity analysis increasing the base WACC assumptions described above by
1%. After performing this sensitivity analysis, the recoverable amount of the CGU still exceeded the carrying amount.
Impairment tests for other regions to which the Chrysler goodwill was reallocated were based on the expected future cash flows for the respective regions
covering the period from 2013 through 2016. The assumptions used to determine the WACCs, the risk premiums and to perform the sensitivity analyses
were consistent with those described above for the NAFTA region. Cash flows were measured in U.S. Dollars and base WACCs of 9.1%, 11.5% and
10.4% were used for the APAC, LATAM and EMEA regions respectively. After performing the sensitivity analyses, the recoverable amount of the APAC,
LATAM and EMEA CGUs still exceeded their carrying amounts.
For the Ferrari sector, the CGU corresponds to the sector as a whole and the expected future cash flows are the operating cash flows taken from the
estimates included in the 2013 budget and the expected business performance, made in a prudent manner, taking account of the uncertainties of the global
financial and economic situation, extrapolated for subsequent years by using the specific medium/long-term growth rate for the sector equal to 2%. These
cash flows were then discounted using a post-tax discount rate of 8.05%. The recoverable amount of the CGU to which the Ferrari sector goodwill relates
is significantly higher than its carrying amount; in addition, the exclusivity of the business, its historical profitability and its future earnings prospects indicate
that this carrying amount will continue to be recoverable, even in the event of difficult economic and market conditions.
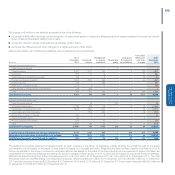
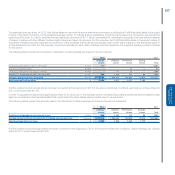
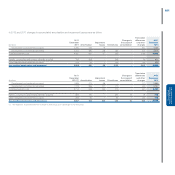
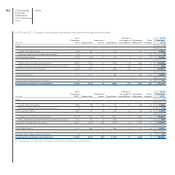
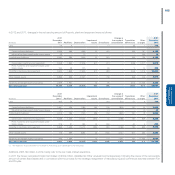
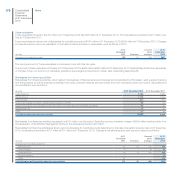
15. Other intangible assets
In 2012 and 2011, changes in the gross carrying amount of Other intangible assets were as follows:
(€ million)
At 31
December
2011 Additions Divestitures
Changes in
the scope of
consolidation
Translation
differences
and other
changes
At 31
December
2012
Development costs externally acquired 3,841 1,547 (4) - (157) 5,227
Development costs internally generated 4,116 591 (51) - (19) 4,637
Total Development costs 7,957 2,138 (55) - (176) 9,864
Patents, concessions and licenses externally acquired 1,982 175 (35) - (22) 2,100
Other intangible assets externally acquired 606 72 (27) - (26) 625
Gross carrying amount 10,545 2,385 (117) - (224) 12,589
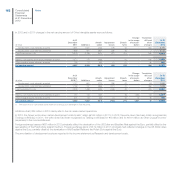
(€ million)
At 31
December
2010 (*) Additions Divestitures
Changes in
the scope of
consolidation
Translation
differences
and other
changes
At 31
December
2011
Development costs externally acquired 3,116 681 (2) - 46 3,841
Development costs internally generated 3,507 757 (12) - (136) 4,116
Total Development costs 6,623 1,438 (14) - (90) 7,957
Patents, concessions and licenses externally acquired 742 115 (35) 1,026 134 1,982
Other intangible assets externally acquired 583 50 (10) (1) (16) 606
Gross carrying amount 7,948 1,603 (59) 1,025 28 10,545
(*) The balances at 31 December 2010 relate to Fiat Group post demerger to Fiat Industrial.