Chrysler 2012 Annual Report Download - page 267
Download and view the complete annual report
Please find page 267 of the 2012 Chrysler annual report below. You can navigate through the pages in the report by either clicking on the pages listed below, or by using the keyword search tool below to find specific information within the annual report.-
 1
1 -
2
-
3
-
4
-
5
-
6
-
7
-
8
-
9
-
10
-
11
-
12
-
13
-
14
-
15
-
16
-
17
-
18
-
19
-
20
-
21
-
22
-
23
-
24
-
25
-
26
-
27
-
28
-
29
-
30
-
31
-
32
-
33
-
34
-
35
-
36
-
37
-
38
-
39
-
40
-
41
-
42
-
43
-
44
-
45
-
46
-
47
-
48
-
49
-
50
-
51
-
52
-
53
-
54
-
55
-
56
-
57
-
58
-
59
-
60
-
61
-
62
-
63
-
64
-
65
-
66
-
67
-
68
-
69
-
70
-
71
-
72
-
73
-
74
-
75
-
76
-
77
-
78
-
79
-
80
-
81
-
82
-
83
-
84
-
85
-
86
-
87
-
88
-
89
-
90
-
91
-
92
-
93
-
94
-
95
-
96
-
97
-
98
-
99
-
100
-
101
-
102
-
103
-
104
-
105
-
106
-
107
-
108
-
109
-
110
-
111
-
112
-
113
-
114
-
115
-
116
-
117
-
118
-
119
-
120
-
121
-
122
-
123
-
124
-
125
-
126
-
127
-
128
-
129
-
130
-
131
-
132
-
133
-
134
-
135
-
136
-
137
-
138
-
139
-
140
-
141
-
142
-
143
-
144
-
145
-
146
-
147
-
148
-
149
-
150
-
151
-
152
-
153
-
154
-
155
-
156
-
157
-
158
-
159
-
160
-
161
-
162
-
163
-
164
-
165
-
166
-
167
-
168
-
169
-
170
-
171
-
172
-
173
-
174
-
175
-
176
-
177
-
178
-
179
-
180
-
181
-
182
-
183
-
184
-
185
-
186
-
187
-
188
-
189
-
190
-
191
-
192
-
193
-
194
-
195
-
196
-
197
-
198
-
199
-
200
-
201
-
202
-
203
-
204
-
205
-
206
-
207
-
208
-
209
-
210
-
211
-
212
-
213
-
214
-
215
-
216
-
217
-
218
-
219
-
220
-
221
-
222
-
223
-
224
-
225
-
226
-
227
-
228
-
229
-
230
-
231
-
232
-
233
-
234
-
235
-
236
-
237
-
238
-
239
-
240
-
241
-
242
-
243
-
244
-
245
-
246
-
247
-
248
-
249
-
250
-
251
-
252
-
253
-
254
-
255
-
256
-
 257
257 -
 258
258 -
 259
259 -
 260
260 -
 261
261 -
 262
262 -
 263
263 -
 264
264 -
 265
265 -
 266
266 -
 267
267 -
 268
268 -
 269
269 -
 270
270 -
 271
271 -
 272
272 -
 273
273 -
 274
274 -
 275
275 -
 276
276 -
 277
277 -
278
-
279
-
280
-
281
-
282
-
283
-
284
-
285
-
286
-
287
-
288
-
289
-
290
-
291
-
292
-
293
-
294
-
295
-
296
-
297
-
298
-
299
-
300
-
301
-
302
-
303
-
304
-
305
-
306
-
307
-
308
-
309
-
310
-
311
-
312
-
313
-
314
-
315
-
316
-
317
-
318
-
319
-
320
-
321
-
322
-
323
-
324
-
325
-
326
-
327
-
328
-
329
-
330
-
331
-
332
-
333
-
334
-
335
-
336
-
337
-
338
-
339
-
340
-
341
-
342
-
343
-
344
-
345
-
346
 |
 |

Notes
266 Fiat S.p.A.
Statutory
Financial
Statements
at 31 December
2012
The investment in Teksid Aluminum S.r.l. was written down by €15.0 million, principally on the basis of the loss it reported for the financial year. The current
carrying amount is considered representative of the investee’s estimated recoverable value.
For Fiat Powertrain Technologies S.p.A., an impairment reversal of €21.1 million was recognized prior to transfer of the investment to Fiat Group Automobiles
S.p.A., as a contribution to capital, at a value of €590.0 million.
Impairment losses recognized on the investments in Comau S.p.A. and Teksid Aluminum S.r.l. in 2011 were substantially due to losses reported by those
companies for the year, which mainly resulted from write-downs on goodwill and certain fixed assets. The adjusted carrying amounts were deemed
representative of the estimated recoverable value of those investments.
The impairment reversal recognized in 2011 for Fiat Gestione Partecipazioni S.p.A. was based on the book value of equity of the investee and its subsidiaries
in the consolidated financial statements following the reorganization carried out during the year.
3. Gains/(losses) on disposals
For 2012, there were no gains or losses on disposals. For 2011, gains on disposals totaled €14,703 thousand, including €12,753 thousand on the sale
of the wholly-owned subsidiary Fiat Switzerland S.A. to CNH International S.A. (a Fiat Industrial Group company) and €1,950 thousand on the sale of a
39.47% equity interest in Fiat Finance North America Inc. to Fiat Finance and Trade Ltd. S.A.
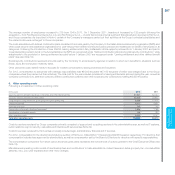
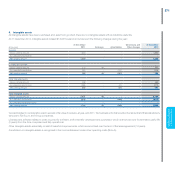
4. Other operating income
Other operating income consisted of the following:
(€ thousand) 2012 2011
Revenues from services rendered to Group companies and other related parties 70,529 37,917
Changes in construction contract work in progress 527 1,621
Other revenues and income from Group companies and other related parties 4,215 4,288
Other revenues and income from third parties 2,103 1,505
Total other operating income 77,374 45,331
Revenues from services rendered to Group companies and other related parties relate almost entirely to services rendered by Fiat S.p.A. and management
personnel to the principal companies in the Group (see Note 29).
Changes in construction contract work in progress relate to the current portion of fees payable to Fiat S.p.A. for activities carried out directly by the
Company (management, coordination and organization) in relation to contracts with Treno Alta Velocità – TAV S.p.A. (now Rete Ferroviaria Italiana S.p.A.)
that were still in progress at the end of the year (the Florence-Bologna and Novara-Milan lines – see Note 25).
Other revenues and income from Group companies and other related parties primarily consisted of cost charge-backs, rental income on real estate and
directors’ fees received from Group companies in relation to Fiat S.p.A. employees serving as board members.
Other revenues and income from third parties relate to miscellaneous income, cost charge-backs and other prior year income.
The overall increase in other operating income over the previous year was primarily due to an increase in services rendered to Group companies, including
the activities of the business units acquired at the end of 2011.
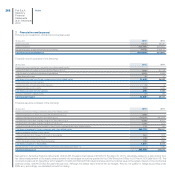
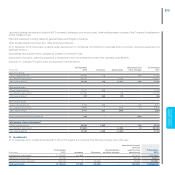
5. Personnel costs
Personnel costs consisted of the following:
(€ thousand) 2012 2011
Wages and salaries 20,223 15,547
Defined contribution plans and social security contributions 8,166 5,968
Leaving entitlement and other defined benefit plans 655 149
Other personnel costs 7,010 13,508
Total personnel costs 36,054 35,172