Chrysler 2012 Annual Report Download - page 156
Download and view the complete annual report
Please find page 156 of the 2012 Chrysler annual report below. You can navigate through the pages in the report by either clicking on the pages listed below, or by using the keyword search tool below to find specific information within the annual report.-
 1
1 -
2
-
3
-
4
-
5
-
6
-
7
-
8
-
9
-
10
-
11
-
12
-
13
-
14
-
15
-
16
-
17
-
18
-
19
-
20
-
21
-
22
-
23
-
24
-
25
-
26
-
27
-
28
-
29
-
30
-
31
-
32
-
33
-
34
-
35
-
36
-
37
-
38
-
39
-
40
-
41
-
42
-
43
-
44
-
45
-
46
-
47
-
48
-
49
-
50
-
51
-
52
-
53
-
54
-
55
-
56
-
57
-
58
-
59
-
60
-
61
-
62
-
63
-
64
-
65
-
66
-
67
-
68
-
69
-
70
-
71
-
72
-
73
-
74
-
75
-
76
-
77
-
78
-
79
-
80
-
81
-
82
-
83
-
84
-
85
-
86
-
87
-
88
-
89
-
90
-
91
-
92
-
93
-
94
-
95
-
96
-
97
-
98
-
99
-
100
-
101
-
102
-
103
-
104
-
105
-
106
-
107
-
108
-
109
-
110
-
111
-
112
-
113
-
114
-
115
-
116
-
117
-
118
-
119
-
120
-
121
-
122
-
123
-
124
-
125
-
126
-
127
-
128
-
129
-
130
-
131
-
132
-
133
-
134
-
135
-
136
-
137
-
138
-
139
-
140
-
141
-
142
-
143
-
144
-
145
-
 146
146 -
 147
147 -
 148
148 -
 149
149 -
 150
150 -
 151
151 -
 152
152 -
 153
153 -
 154
154 -
 155
155 -
 156
156 -
 157
157 -
 158
158 -
 159
159 -
 160
160 -
 161
161 -
 162
162 -
 163
163 -
 164
164 -
 165
165 -
 166
166 -
167
-
168
-
169
-
170
-
171
-
172
-
173
-
174
-
175
-
176
-
177
-
178
-
179
-
180
-
181
-
182
-
183
-
184
-
185
-
186
-
187
-
188
-
189
-
190
-
191
-
192
-
193
-
194
-
195
-
196
-
197
-
198
-
199
-
200
-
201
-
202
-
203
-
204
-
205
-
206
-
207
-
208
-
209
-
210
-
211
-
212
-
213
-
214
-
215
-
216
-
217
-
218
-
219
-
220
-
221
-
222
-
223
-
224
-
225
-
226
-
227
-
228
-
229
-
230
-
231
-
232
-
233
-
234
-
235
-
236
-
237
-
238
-
239
-
240
-
241
-
242
-
243
-
244
-
245
-
246
-
247
-
248
-
249
-
250
-
251
-
252
-
253
-
254
-
255
-
256
-
257
-
258
-
259
-
260
-
261
-
262
-
263
-
264
-
265
-
266
-
267
-
268
-
269
-
270
-
271
-
272
-
273
-
274
-
275
-
276
-
277
-
278
-
279
-
280
-
281
-
282
-
283
-
284
-
285
-
286
-
287
-
288
-
289
-
290
-
291
-
292
-
293
-
294
-
295
-
296
-
297
-
298
-
299
-
300
-
301
-
302
-
303
-
304
-
305
-
306
-
307
-
308
-
309
-
310
-
311
-
312
-
313
-
314
-
315
-
316
-
317
-
318
-
319
-
320
-
321
-
322
-
323
-
324
-
325
-
326
-
327
-
328
-
329
-
330
-
331
-
332
-
333
-
334
-
335
-
336
-
337
-
338
-
339
-
340
-
341
-
342
-
343
-
344
-
345
-
346
 |
 |

155
Consolidated
Financial Statements
at 31 December 2012
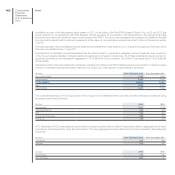
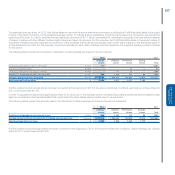
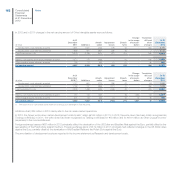
The change of €4 million in net deferred tax assets is due to the following:
net benefit of €69 million deriving from the recognition of deferred tax assets on temporary differences and tax losses originated in the year net of write-
down of deferred tax assets relating to prior years;
recognition directly to equity of net deferred tax liabilities of €23 million;
exchange rate differences and other changes for a negative amount of €42 million.
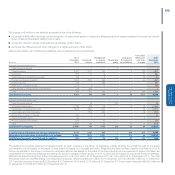
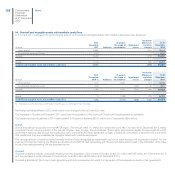
Deferred tax assets, net of Deferred tax liabilities may be analysed by source as follows:
(€ million)
At 31
December
2011
Reclassifi-
cations
Recognised
in income
statement
Charged to
equity
Changes in
the scope of
consolidation
Translation
differences
and other
changes
At 31
December
2012
Deferred tax assets arising from:
Cash flow hedge reserve - 7 - 2 - - 9
Taxed provisions 3,097 (271) 162 - 2 (79) 2,911
Inventories 229 22 15 - - (2) 264
Taxed allowances for doubtful accounts 85 - 9 - - (4) 90
Provision for employee benefits 1,374 (302) (50) - - (2) 1,020
Intangible assets 419 - (38) - - - 381
Write-downs of financial assets 212 4 12 - - - 228
Measurement of derivative financial instruments 33 (30) - - - - 3
Other 538 912 (10) - 37 (33) 1,444
Total Deferred tax assets 5,987 342 100 2 39 (120) 6,350
Deferred tax liabilities arising from:
Cash flow hedge reserve - 16 - (25) - - (9)
Accelerated depreciation (1,733) 316 35 - (1) 29 (1,354)
Capitalisation of development costs (800) (296) (140) - - 25 (1,211)
Trade-marks and other intangibles - (713) (89) - - 18 (784)
Deferred tax on gains on disposal (14) - 8 - - - (6)
Capital investment grants (3) - - - - 3 -
Provision for employee benefits (19) - (2) - - - (21)
Other (1,340) 786 50 - (1) (7) (512)
Total Deferred tax liabilities (3,909) 109 (138) (25) (2) 68 (3,897)
Theoretical tax benefit arising from tax loss carryforwards 3,215 (162) 392 - (20) (26) 3,399
Adjustments for assets whose recoverability is not probable (4,363) (299) (285) - (19) 48 (4,918)
Total Deferred tax assets, net of Deferred tax liabilities 930 (10) 69 (23) (2) (30) 934
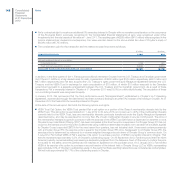
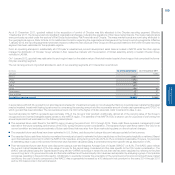
The decision to recognise Deferred tax assets is taken for each company in the Group by assessing critically whether the conditions exist for the future
recoverability of such assets on the basis of most recent forecasts from budgets and plans. Regarding the Italian entities, despite a tax loss for 2012 in
the tax consolidation, the Group continued to recognise deferred tax assets on the basis of the future taxable income expected to arise in the Italian tax
consolidation in the period considered and taking into account changes in Italian tax law in 2011 by which the tax losses can be carried forward indefinitely.
Deferred tax assets arising from Italian companies amount to €1,063 million at 31 December 2012 (€1,033 million at 31 December 2011). The total
theoretical future tax benefits arising from deductible temporary differences (€6,350 million at 31 December 2012 and €5,987 million at 31 December
2011) and tax loss carry-forwards (€3,399 million at 31 December 2012 and €3,215 million at 31 December 2011) have been reduced by €4,918 million at
31 December 2012 (€4,363 million at 31 December 2011).