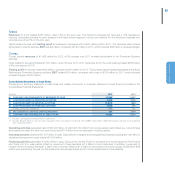
Chrysler 2012 Annual Report Download - page 60
Download and view the complete annual report
Please find page 60 of the 2012 Chrysler annual report below. You can navigate through the pages in the report by either clicking on the pages listed below, or by using the keyword search tool below to find specific information within the annual report.-
 1
1 -
2
-
3
-
4
-
5
-
6
-
7
-
8
-
9
-
10
-
11
-
12
-
13
-
14
-
15
-
16
-
17
-
18
-
19
-
20
-
21
-
22
-
23
-
24
-
25
-
26
-
27
-
28
-
29
-
30
-
31
-
32
-
33
-
34
-
35
-
36
-
37
-
38
-
39
-
40
-
41
-
42
-
43
-
44
-
45
-
46
-
47
-
48
-
49
-
 50
50 -
 51
51 -
 52
52 -
 53
53 -
 54
54 -
 55
55 -
 56
56 -
 57
57 -
 58
58 -
 59
59 -
 60
60 -
 61
61 -
 62
62 -
 63
63 -
 64
64 -
 65
65 -
 66
66 -
 67
67 -
 68
68 -
 69
69 -
 70
70 -
71
-
72
-
73
-
74
-
75
-
76
-
77
-
78
-
79
-
80
-
81
-
82
-
83
-
84
-
85
-
86
-
87
-
88
-
89
-
90
-
91
-
92
-
93
-
94
-
95
-
96
-
97
-
98
-
99
-
100
-
101
-
102
-
103
-
104
-
105
-
106
-
107
-
108
-
109
-
110
-
111
-
112
-
113
-
114
-
115
-
116
-
117
-
118
-
119
-
120
-
121
-
122
-
123
-
124
-
125
-
126
-
127
-
128
-
129
-
130
-
131
-
132
-
133
-
134
-
135
-
136
-
137
-
138
-
139
-
140
-
141
-
142
-
143
-
144
-
145
-
146
-
147
-
148
-
149
-
150
-
151
-
152
-
153
-
154
-
155
-
156
-
157
-
158
-
159
-
160
-
161
-
162
-
163
-
164
-
165
-
166
-
167
-
168
-
169
-
170
-
171
-
172
-
173
-
174
-
175
-
176
-
177
-
178
-
179
-
180
-
181
-
182
-
183
-
184
-
185
-
186
-
187
-
188
-
189
-
190
-
191
-
192
-
193
-
194
-
195
-
196
-
197
-
198
-
199
-
200
-
201
-
202
-
203
-
204
-
205
-
206
-
207
-
208
-
209
-
210
-
211
-
212
-
213
-
214
-
215
-
216
-
217
-
218
-
219
-
220
-
221
-
222
-
223
-
224
-
225
-
226
-
227
-
228
-
229
-
230
-
231
-
232
-
233
-
234
-
235
-
236
-
237
-
238
-
239
-
240
-
241
-
242
-
243
-
244
-
245
-
246
-
247
-
248
-
249
-
250
-
251
-
252
-
253
-
254
-
255
-
256
-
257
-
258
-
259
-
260
-
261
-
262
-
263
-
264
-
265
-
266
-
267
-
268
-
269
-
270
-
271
-
272
-
273
-
274
-
275
-
276
-
277
-
278
-
279
-
280
-
281
-
282
-
283
-
284
-
285
-
286
-
287
-
288
-
289
-
290
-
291
-
292
-
293
-
294
-
295
-
296
-
297
-
298
-
299
-
300
-
301
-
302
-
303
-
304
-
305
-
306
-
307
-
308
-
309
-
310
-
311
-
312
-
313
-
314
-
315
-
316
-
317
-
318
-
319
-
320
-
321
-
322
-
323
-
324
-
325
-
326
-
327
-
328
-
329
-
330
-
331
-
332
-
333
-
334
-
335
-
336
-
337
-
338
-
339
-
340
-
341
-
342
-
343
-
344
-
345
-
346
 |
 |

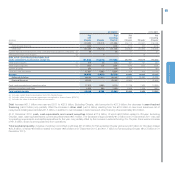
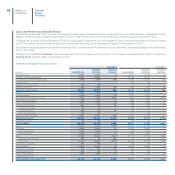
59
Report on Operations
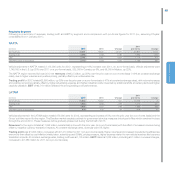
Net Debt by Activity
31.12.2012 31.12.2011
(€ million) Consolidated
Industrial
Activities
Financial
Services Consolidated
Industrial
Activities
Financial
Services
Debt: (27,889) (25,933) (3,472) (26,772) (24,796) (3,595)
Asset-backed financing (449) (52) (397) (710) (213) (497)
Other debt (27,440) (25,790) (1,650) (26,062) (24,503) (1,559)
Intersegment financial payables - (91) (1,425) - (80) (1,539)
Current financial receivables from
jointly-controlled financial services companies (a) 58 58 - 21 21 -
Intersegment financial receivables - 1,425 91 - 1,539 80
Debt, net of intersegment and current financial receivables
from jointly-controlled financial services companies (27,831) (24,450) (3,381) (26,751) (23,236) (3,515)
Other financial assets (b) 519 519 - 557 559 -
Other financial liabilities (b) (201) (198) (3) (429) (428) (3)
Current securities 256 173 83 199 147 52
Cash and cash equivalents 17,657 17,411 246 17,526 17,429 97
Net debt (9,600) (6,545) (3,055) (8,898) (5,529) (3,369)
(a) Includes current debt payable by FGA Capital to other Fiat Group companies.
(b) Includes fair value of derivative financial instruments.
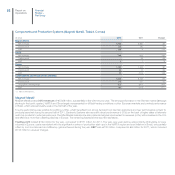
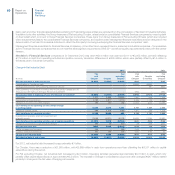
Net Debt by Activity for Fiat excluding Chrysler
31.12.2012 31.12.2011
(€ million)
Fiat
excluding
Chrysler
Industrial
Activities
excluding
Chrysler
Financial
Services
Fiat
excluding
Chrysler
Industrial
Activities
excluding
Chrysler
Financial
Services
Debt: (17,586) (15,630) (3,472) (16,245) (14,269) (3,595)
Asset-backed financing (449) (52) (397) (679) (182) (497)
Other debt (17,137) (15,487) (1,650) (15,566) (14,007) (1,559)
Intersegment financial payables - (91) (1,425) - (80) (1,539)
Current financial receivables from
jointly-controlled financial services companies (a) 58 58 - 21 21 -
Intersegment financial receivables - 1,425 91 - 1,539 80
Debt, net of intersegment and current financial receivables
from jointly-controlled financial services companies (17,528) (14,147) (3,381) (16,224) (12,709) (3,515)
Other financial assets (b) 474 474 - 430 432 -
Other financial liabilities (b) (159) (156) (3) (329) (328) (3)
Current securities 256 173 83 199 147 52
Cash and cash equivalents 8,854 8,608 246 10,106 10,009 97
Net debt (8,103) (5,048) (3,055) (5,818) (2,449) (3,369)
(a) Includes current debt payable by FGA Capital to other Fiat Group companies.
(b) Includes fair value of derivative financial instruments.