Chrysler 2012 Annual Report Download - page 169
Download and view the complete annual report
Please find page 169 of the 2012 Chrysler annual report below. You can navigate through the pages in the report by either clicking on the pages listed below, or by using the keyword search tool below to find specific information within the annual report.-
 1
1 -
2
-
3
-
4
-
5
-
6
-
7
-
8
-
9
-
10
-
11
-
12
-
13
-
14
-
15
-
16
-
17
-
18
-
19
-
20
-
21
-
22
-
23
-
24
-
25
-
26
-
27
-
28
-
29
-
30
-
31
-
32
-
33
-
34
-
35
-
36
-
37
-
38
-
39
-
40
-
41
-
42
-
43
-
44
-
45
-
46
-
47
-
48
-
49
-
50
-
51
-
52
-
53
-
54
-
55
-
56
-
57
-
58
-
59
-
60
-
61
-
62
-
63
-
64
-
65
-
66
-
67
-
68
-
69
-
70
-
71
-
72
-
73
-
74
-
75
-
76
-
77
-
78
-
79
-
80
-
81
-
82
-
83
-
84
-
85
-
86
-
87
-
88
-
89
-
90
-
91
-
92
-
93
-
94
-
95
-
96
-
97
-
98
-
99
-
100
-
101
-
102
-
103
-
104
-
105
-
106
-
107
-
108
-
109
-
110
-
111
-
112
-
113
-
114
-
115
-
116
-
117
-
118
-
119
-
120
-
121
-
122
-
123
-
124
-
125
-
126
-
127
-
128
-
129
-
130
-
131
-
132
-
133
-
134
-
135
-
136
-
137
-
138
-
139
-
140
-
141
-
142
-
143
-
144
-
145
-
146
-
147
-
148
-
149
-
150
-
151
-
152
-
153
-
154
-
155
-
156
-
157
-
158
-
 159
159 -
 160
160 -
 161
161 -
 162
162 -
 163
163 -
 164
164 -
 165
165 -
 166
166 -
 167
167 -
 168
168 -
 169
169 -
 170
170 -
 171
171 -
 172
172 -
 173
173 -
 174
174 -
 175
175 -
 176
176 -
 177
177 -
 178
178 -
 179
179 -
180
-
181
-
182
-
183
-
184
-
185
-
186
-
187
-
188
-
189
-
190
-
191
-
192
-
193
-
194
-
195
-
196
-
197
-
198
-
199
-
200
-
201
-
202
-
203
-
204
-
205
-
206
-
207
-
208
-
209
-
210
-
211
-
212
-
213
-
214
-
215
-
216
-
217
-
218
-
219
-
220
-
221
-
222
-
223
-
224
-
225
-
226
-
227
-
228
-
229
-
230
-
231
-
232
-
233
-
234
-
235
-
236
-
237
-
238
-
239
-
240
-
241
-
242
-
243
-
244
-
245
-
246
-
247
-
248
-
249
-
250
-
251
-
252
-
253
-
254
-
255
-
256
-
257
-
258
-
259
-
260
-
261
-
262
-
263
-
264
-
265
-
266
-
267
-
268
-
269
-
270
-
271
-
272
-
273
-
274
-
275
-
276
-
277
-
278
-
279
-
280
-
281
-
282
-
283
-
284
-
285
-
286
-
287
-
288
-
289
-
290
-
291
-
292
-
293
-
294
-
295
-
296
-
297
-
298
-
299
-
300
-
301
-
302
-
303
-
304
-
305
-
306
-
307
-
308
-
309
-
310
-
311
-
312
-
313
-
314
-
315
-
316
-
317
-
318
-
319
-
320
-
321
-
322
-
323
-
324
-
325
-
326
-
327
-
328
-
329
-
330
-
331
-
332
-
333
-
334
-
335
-
336
-
337
-
338
-
339
-
340
-
341
-
342
-
343
-
344
-
345
-
346
 |
 |

Notes
168 Consolidated
Financial
Statements
at 31 December
2012
At 31 December 2011, Investments also included the investment in Sevelnord Société Anonyme carried at €89 million. As discussed in the section Scope
of consolidation this investment, carried at €91 million at 30 June 2012, was reclassified to Assets held for sale at that date and measured at fair value.
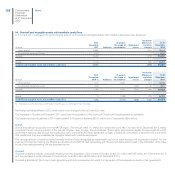
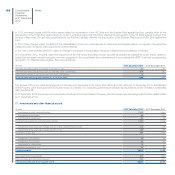
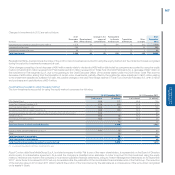
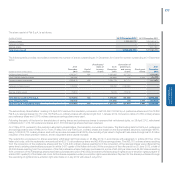
At 31 December 2012, the stock market price of Investments in listed jointly controlled entities and listed associates is as follows:
(€ million) Carrying value Stock market price
Tofas -Turk Otomobil Fabrikasi A.S. 329 840
Rizzoli Corriere della Sera MediaGroup S.p.A. 28 97
Total Investments in listed jointly controlled entities and associates 357 937
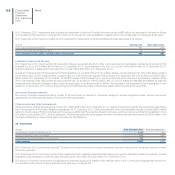
Investments measured at fair value
At 31 December 2012, Investments at fair value with changes recognised directly in Other comprehensive income/(losses), include the investment in Fiat
Industrial S.p.A. for €130 million (€104 million at 31 December 2011), the investment in Fin. Priv. S.r.l. for €10 million (€10 million at 31 December 2011),
and the investment in Assicurazioni Generali S.p.A. for €2 million (€2 million at 31 December 2011).
Overall, at 31 December 2012 the investment in Fiat Industrial S.p.A. consists of 34,216,027 ordinary shares, corresponding to the 2.8% of the share capital of
the company (38,215,333 ordinary shares, corresponding to 3.00% of the share capital of the company at 31 December 2011) for an amount of €283 million
(€253 million at 31 December 2011), of which 18,496,875 shares of Fiat Industrial S.p.A. will serve the stock option plans and are therefore measured at fair
value, with changes in fair value posted through profit and loss, for an amount of €153 million, and 15,719,152 shares are classified as available-for-sale and
measured at fair value, with changes in value posted through equity, for an amount of €130 million. The decrease in the investment in Fiat Industrial S.p.A. with
respect to 31 December 2011 is due to the granting to the Chief Executive Officer of the shares vested under the 2009 Stock Grant Plan.
Non-current financial receivables
Non-current financial receivables mainly consist of amounts held on deposit or otherwise pledged to secure obligations under various commercial
agreements, as well as standby letters of credit and other agreements.
Other securities and other financial assets
Other securities and other financial assets include €57 million (€58 million at 31 December 2011 ) relating to the amount paid for the contractual rights arising
from the acquisition of the Equity Recapture Agreement. At 31 December 2011, Other securities and other financial assets had also included €320 million
relating to the fair value of Fiat’s contractual right to receive an additional 5% ownership interest in Chrysler upon the occurrence of the Ecological Event, which
took place in early January 2012. As a consequence, this financial asset was derecognised and Non-controlling interests were reduced by €359 million, with
the Equity attributable to owners of the parent increased for the difference.
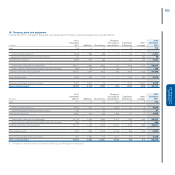
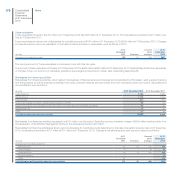
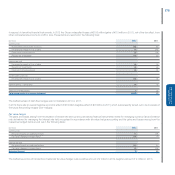
18. Inventories
(€ million) At 31 December 2012 At 31 December 2011
Raw materials, supplies and finished goods 8,160 7,555
Assets sold with a buy-back commitment 952 1,394
Gross amount due from customers for contract work 183 174
Total Inventories 9,295 9,123
At 31 December 2012, Inventories rose by €172 million in line with the trend in production and sales volumes for the period in the various markets in which
the Group operates.
At 31 December 2012, Inventories include those measured at net realisable value (estimated selling price less the estimated costs of completion and the
estimated costs necessary to make the sale) amounting to €1,293 million (€1,343 million at 31 December 2011).
The amount of inventory write-downs recognised as an expense during 2012 is €634 million (€528 million in 2011). Amounts recognised as income from
the reversal of write-downs on items sold during the year were not significant.