Chrysler 2012 Annual Report Download - page 165
Download and view the complete annual report
Please find page 165 of the 2012 Chrysler annual report below. You can navigate through the pages in the report by either clicking on the pages listed below, or by using the keyword search tool below to find specific information within the annual report.-
 1
1 -
2
-
3
-
4
-
5
-
6
-
7
-
8
-
9
-
10
-
11
-
12
-
13
-
14
-
15
-
16
-
17
-
18
-
19
-
20
-
21
-
22
-
23
-
24
-
25
-
26
-
27
-
28
-
29
-
30
-
31
-
32
-
33
-
34
-
35
-
36
-
37
-
38
-
39
-
40
-
41
-
42
-
43
-
44
-
45
-
46
-
47
-
48
-
49
-
50
-
51
-
52
-
53
-
54
-
55
-
56
-
57
-
58
-
59
-
60
-
61
-
62
-
63
-
64
-
65
-
66
-
67
-
68
-
69
-
70
-
71
-
72
-
73
-
74
-
75
-
76
-
77
-
78
-
79
-
80
-
81
-
82
-
83
-
84
-
85
-
86
-
87
-
88
-
89
-
90
-
91
-
92
-
93
-
94
-
95
-
96
-
97
-
98
-
99
-
100
-
101
-
102
-
103
-
104
-
105
-
106
-
107
-
108
-
109
-
110
-
111
-
112
-
113
-
114
-
115
-
116
-
117
-
118
-
119
-
120
-
121
-
122
-
123
-
124
-
125
-
126
-
127
-
128
-
129
-
130
-
131
-
132
-
133
-
134
-
135
-
136
-
137
-
138
-
139
-
140
-
141
-
142
-
143
-
144
-
145
-
146
-
147
-
148
-
149
-
150
-
151
-
152
-
153
-
154
-
 155
155 -
 156
156 -
 157
157 -
 158
158 -
 159
159 -
 160
160 -
 161
161 -
 162
162 -
 163
163 -
 164
164 -
 165
165 -
 166
166 -
 167
167 -
 168
168 -
 169
169 -
 170
170 -
 171
171 -
 172
172 -
 173
173 -
 174
174 -
 175
175 -
176
-
177
-
178
-
179
-
180
-
181
-
182
-
183
-
184
-
185
-
186
-
187
-
188
-
189
-
190
-
191
-
192
-
193
-
194
-
195
-
196
-
197
-
198
-
199
-
200
-
201
-
202
-
203
-
204
-
205
-
206
-
207
-
208
-
209
-
210
-
211
-
212
-
213
-
214
-
215
-
216
-
217
-
218
-
219
-
220
-
221
-
222
-
223
-
224
-
225
-
226
-
227
-
228
-
229
-
230
-
231
-
232
-
233
-
234
-
235
-
236
-
237
-
238
-
239
-
240
-
241
-
242
-
243
-
244
-
245
-
246
-
247
-
248
-
249
-
250
-
251
-
252
-
253
-
254
-
255
-
256
-
257
-
258
-
259
-
260
-
261
-
262
-
263
-
264
-
265
-
266
-
267
-
268
-
269
-
270
-
271
-
272
-
273
-
274
-
275
-
276
-
277
-
278
-
279
-
280
-
281
-
282
-
283
-
284
-
285
-
286
-
287
-
288
-
289
-
290
-
291
-
292
-
293
-
294
-
295
-
296
-
297
-
298
-
299
-
300
-
301
-
302
-
303
-
304
-
305
-
306
-
307
-
308
-
309
-
310
-
311
-
312
-
313
-
314
-
315
-
316
-
317
-
318
-
319
-
320
-
321
-
322
-
323
-
324
-
325
-
326
-
327
-
328
-
329
-
330
-
331
-
332
-
333
-
334
-
335
-
336
-
337
-
338
-
339
-
340
-
341
-
342
-
343
-
344
-
345
-
346
 |
 |

Notes
164 Consolidated
Financial
Statements
at 31 December
2012
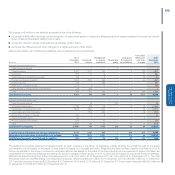
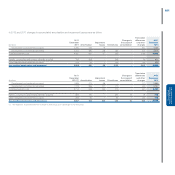
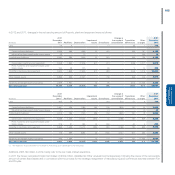
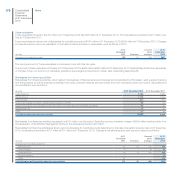
In 2012 and 2011, Changes in accumulated depreciation and impairment losses were as follows:
(€ (million)
At 31
December
2011 Depreciation
Impairment
losses Divestitures
Change in
the scope of
consolidation
Translation
differences
Other
changes
At 31
December
2012
Land 7 - - - - - - 7
Owned industrial buildings 1,999 253 2 (13) 2 (22) 7 2,228
Industrial buildings leased under finance leases 14 1 - - - - (10) 5
Total Industrial buildings 2,013 254 2 (13) 2 (22) (3) 2,233
Owned plant, machinery and equipment 18,943 1,915 47 (795) (12) (168) 6 19,936
Plant, machinery and equipment leased under finance leases 105 27 - - (6) 1 1 128
Total Plant, machinery and equipment 19,048 1,942 47 (795) (18) (167) 7 20,064
Other tangible assets 1,510 1,057 - (56) 2 (50) (65) 2,398
Advances and tangible assets in progress 10 - 1 - - - (1) 10
Accumulated depreciation and impairment 22,588 3,253 50 (864) (14) (239) (62) 24,712
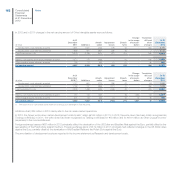
(€ million)
At 31
December
2010 (*) Depreciation
Impairment
losses Divestitures
Change in
the scope of
consolidation
Translation
differences
Other
changes
At 31
December
2011
Land 7 - - - - - - 7
Owned industrial buildings 1,836 189 35 (12) (1) (44) (4) 1,999
Industrial buildings leased under finance leases 13 2 - (1) - - - 14
Total Industrial buildings 1,849 191 35 (13) (1) (44) (4) 2,013
Owned plant, machinery and equipment 18,150 1,640 281 (831) 13 (330) 20 18,943
Plant, machinery and equipment leased under finance leases 157 30 4 (85) - (1) - 105
Total Plant, machinery and equipment 18,307 1,670 285 (916) 13 (331) 20 19,048
Other tangible assets 871 684 2 (89) (1) 47 (4) 1,510
Advances and tangible assets in progress 18 - 1 - - - (9) 10
Accumulated depreciation and impairment 21,052 2,545 323 (1,018) 11 (328) 3 22,588
(*) The balances at 31 December 2010 relate to Fiat Group post demerger to Fiat Industrial.