Chrysler 2012 Annual Report Download - page 47
Download and view the complete annual report
Please find page 47 of the 2012 Chrysler annual report below. You can navigate through the pages in the report by either clicking on the pages listed below, or by using the keyword search tool below to find specific information within the annual report.-
 1
1 -
2
-
3
-
4
-
5
-
6
-
7
-
8
-
9
-
10
-
11
-
12
-
13
-
14
-
15
-
16
-
17
-
18
-
19
-
20
-
21
-
22
-
23
-
24
-
25
-
26
-
27
-
28
-
29
-
30
-
31
-
32
-
33
-
34
-
35
-
36
-
 37
37 -
 38
38 -
 39
39 -
 40
40 -
 41
41 -
 42
42 -
 43
43 -
 44
44 -
 45
45 -
 46
46 -
 47
47 -
 48
48 -
 49
49 -
 50
50 -
 51
51 -
 52
52 -
 53
53 -
 54
54 -
 55
55 -
 56
56 -
 57
57 -
58
-
59
-
60
-
61
-
62
-
63
-
64
-
65
-
66
-
67
-
68
-
69
-
70
-
71
-
72
-
73
-
74
-
75
-
76
-
77
-
78
-
79
-
80
-
81
-
82
-
83
-
84
-
85
-
86
-
87
-
88
-
89
-
90
-
91
-
92
-
93
-
94
-
95
-
96
-
97
-
98
-
99
-
100
-
101
-
102
-
103
-
104
-
105
-
106
-
107
-
108
-
109
-
110
-
111
-
112
-
113
-
114
-
115
-
116
-
117
-
118
-
119
-
120
-
121
-
122
-
123
-
124
-
125
-
126
-
127
-
128
-
129
-
130
-
131
-
132
-
133
-
134
-
135
-
136
-
137
-
138
-
139
-
140
-
141
-
142
-
143
-
144
-
145
-
146
-
147
-
148
-
149
-
150
-
151
-
152
-
153
-
154
-
155
-
156
-
157
-
158
-
159
-
160
-
161
-
162
-
163
-
164
-
165
-
166
-
167
-
168
-
169
-
170
-
171
-
172
-
173
-
174
-
175
-
176
-
177
-
178
-
179
-
180
-
181
-
182
-
183
-
184
-
185
-
186
-
187
-
188
-
189
-
190
-
191
-
192
-
193
-
194
-
195
-
196
-
197
-
198
-
199
-
200
-
201
-
202
-
203
-
204
-
205
-
206
-
207
-
208
-
209
-
210
-
211
-
212
-
213
-
214
-
215
-
216
-
217
-
218
-
219
-
220
-
221
-
222
-
223
-
224
-
225
-
226
-
227
-
228
-
229
-
230
-
231
-
232
-
233
-
234
-
235
-
236
-
237
-
238
-
239
-
240
-
241
-
242
-
243
-
244
-
245
-
246
-
247
-
248
-
249
-
250
-
251
-
252
-
253
-
254
-
255
-
256
-
257
-
258
-
259
-
260
-
261
-
262
-
263
-
264
-
265
-
266
-
267
-
268
-
269
-
270
-
271
-
272
-
273
-
274
-
275
-
276
-
277
-
278
-
279
-
280
-
281
-
282
-
283
-
284
-
285
-
286
-
287
-
288
-
289
-
290
-
291
-
292
-
293
-
294
-
295
-
296
-
297
-
298
-
299
-
300
-
301
-
302
-
303
-
304
-
305
-
306
-
307
-
308
-
309
-
310
-
311
-
312
-
313
-
314
-
315
-
316
-
317
-
318
-
319
-
320
-
321
-
322
-
323
-
324
-
325
-
326
-
327
-
328
-
329
-
330
-
331
-
332
-
333
-
334
-
335
-
336
-
337
-
338
-
339
-
340
-
341
-
342
-
343
-
344
-
345
-
346
 |
 |

46
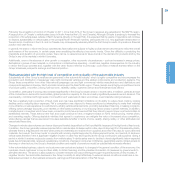
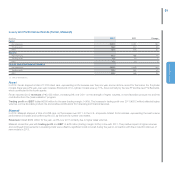
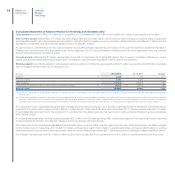
For 2012, Group revenues totaled approximately €84 billion, increasing 12% over the prior year on a pro-
forma1 basis (+8% at constant exchange rates). Strong year-over-year increases were reported in NAFTA (+29%
or 19% at constant exchange rates) and APAC (+50%). LATAM remained strong, while EMEA declined 11% on
the back of a continued deterioration in European demand, particularly in Italy. Luxury and Performance brands
posted a 7% increase in revenues to €2.9 billion, mainly driven by growth in North America and Asia Pacific. For
Components, revenues were substantially in line with 2011 at €8.0 billion.
Trading profit totaled €3,814 million, a year-over-year increase of 18% on a pro-forma basis (+11% at constant
exchange rates). For the NAFTA region, trading profit improved by €1 billion to €2,693 million, driven by strong
volume growth, positive pricing and favorable currency translation. LATAM performed to expectations, posting
€1,063 million of trading profit maintaining double-digit trading margin despite a 25% decrease compared to the
prior year, which principally stemmed from cost inflation, pricing pressure and unfavorable currency translation
impacts, only partially offset by higher volumes and efficiency gains. APAC reported €260 million, nearly double
the prior year. EMEA recorded a loss of €704 million, with cost containment actions only partially mitigating the
impact of reduced volumes and pricing pressures. Growth for Luxury and Performance brands continued, with
trading profit improving €40 million to €392 million. Components contributed €176 million.
(1) Includes Chrysler results as if consolidated from 1 January 2011.
Financial
Review –
Fiat Group
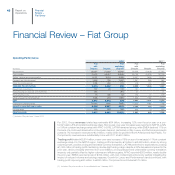
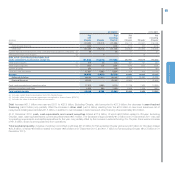
Financial Review – Fiat Group
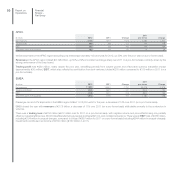
Operating Performance
2012 2011 (*)
(€ million)
Fiat
with
Chrysler Chrysler
Fiat
excluding
Chrysler
Fiat
with
Chrysler Chrysler
Fiat
excluding
Chrysler
Net revenues 83,957 51,202 35,566 59,559 23,609 37,382
Cost of sales 71,474 43,187 31,098 50,704 20,003 32,133
Selling, general and administrative 6,731 3,732 2,999 5,047 1,866 3,181
Research and development 1,835 798 1,037 1,367 385 982
Other income/(expense) (103) (26) (77) (49) (10) (39)
TRADING PROFIT/(LOSS) 3,814 3,459 355 2,392 1,345 1,047
Result from investments 107 (3) 110 131 1 130
Gains/(losses) on disposal of investments (91) - (91) 21 - 21
Restructuring costs 15 (48) 63 102 (7) 109
Other unusual income/(expense) (138) (31) (107) 1,025 (152) 1,177
EBIT 3,677 3,473 204 3,467 1,201 2,266
Financial income/(expense) (1,641) (816) (825) (1,282) (486) (796)
PROFIT/(LOSS) BEFORE TAXES 2,036 2,657 (621) 2,185 715 1,470
Income taxes 625 205 420 534 70 464
PROFIT/(LOSS) 1,411 2,452 (1,041) 1,651 645 1,006
(*) Includes Chrysler from 1 June 2011.
Report on
Operations