Chrysler 2012 Annual Report Download - page 254
Download and view the complete annual report
Please find page 254 of the 2012 Chrysler annual report below. You can navigate through the pages in the report by either clicking on the pages listed below, or by using the keyword search tool below to find specific information within the annual report.-
 1
1 -
2
-
3
-
4
-
5
-
6
-
7
-
8
-
9
-
10
-
11
-
12
-
13
-
14
-
15
-
16
-
17
-
18
-
19
-
20
-
21
-
22
-
23
-
24
-
25
-
26
-
27
-
28
-
29
-
30
-
31
-
32
-
33
-
34
-
35
-
36
-
37
-
38
-
39
-
40
-
41
-
42
-
43
-
44
-
45
-
46
-
47
-
48
-
49
-
50
-
51
-
52
-
53
-
54
-
55
-
56
-
57
-
58
-
59
-
60
-
61
-
62
-
63
-
64
-
65
-
66
-
67
-
68
-
69
-
70
-
71
-
72
-
73
-
74
-
75
-
76
-
77
-
78
-
79
-
80
-
81
-
82
-
83
-
84
-
85
-
86
-
87
-
88
-
89
-
90
-
91
-
92
-
93
-
94
-
95
-
96
-
97
-
98
-
99
-
100
-
101
-
102
-
103
-
104
-
105
-
106
-
107
-
108
-
109
-
110
-
111
-
112
-
113
-
114
-
115
-
116
-
117
-
118
-
119
-
120
-
121
-
122
-
123
-
124
-
125
-
126
-
127
-
128
-
129
-
130
-
131
-
132
-
133
-
134
-
135
-
136
-
137
-
138
-
139
-
140
-
141
-
142
-
143
-
144
-
145
-
146
-
147
-
148
-
149
-
150
-
151
-
152
-
153
-
154
-
155
-
156
-
157
-
158
-
159
-
160
-
161
-
162
-
163
-
164
-
165
-
166
-
167
-
168
-
169
-
170
-
171
-
172
-
173
-
174
-
175
-
176
-
177
-
178
-
179
-
180
-
181
-
182
-
183
-
184
-
185
-
186
-
187
-
188
-
189
-
190
-
191
-
192
-
193
-
194
-
195
-
196
-
197
-
198
-
199
-
200
-
201
-
202
-
203
-
204
-
205
-
206
-
207
-
208
-
209
-
210
-
211
-
212
-
213
-
214
-
215
-
216
-
217
-
218
-
219
-
220
-
221
-
222
-
223
-
224
-
225
-
226
-
227
-
228
-
229
-
230
-
231
-
232
-
233
-
234
-
235
-
236
-
237
-
238
-
239
-
240
-
241
-
242
-
243
-
 244
244 -
 245
245 -
 246
246 -
 247
247 -
 248
248 -
 249
249 -
 250
250 -
 251
251 -
 252
252 -
 253
253 -
 254
254 -
 255
255 -
 256
256 -
 257
257 -
 258
258 -
 259
259 -
 260
260 -
 261
261 -
 262
262 -
 263
263 -
 264
264 -
265
-
266
-
267
-
268
-
269
-
270
-
271
-
272
-
273
-
274
-
275
-
276
-
277
-
278
-
279
-
280
-
281
-
282
-
283
-
284
-
285
-
286
-
287
-
288
-
289
-
290
-
291
-
292
-
293
-
294
-
295
-
296
-
297
-
298
-
299
-
300
-
301
-
302
-
303
-
304
-
305
-
306
-
307
-
308
-
309
-
310
-
311
-
312
-
313
-
314
-
315
-
316
-
317
-
318
-
319
-
320
-
321
-
322
-
323
-
324
-
325
-
326
-
327
-
328
-
329
-
330
-
331
-
332
-
333
-
334
-
335
-
336
-
337
-
338
-
339
-
340
-
341
-
342
-
343
-
344
-
345
-
346
 |
 |

253
Fiat S.p.A.
Statutory
Financial
Statements
at 31 December
2012
Fiat S.p.A. - Statutory
Financial Statements
at 31 December 2012
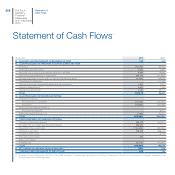
Statement of
Cash Flows
pursuant to Consob
Resolution 15519
of 27 July 2006
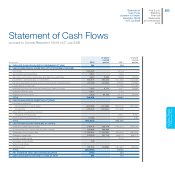
Statement of Cash Flows
pursuant to Consob Resolution 15519 of 27 July 2006
(€ thousand) 2012
of which
related
parties 2011
of which
related
parties
A) CASH AND CASH EQUIVALENTS AT BEGINNING OF YEAR 744 240
B) CASH FROM/(USED IN) OPERATING ACTIVITIES DURING THE YEAR:
Profit/(loss) (152,350) 99,166
Amortization and depreciation 2,004 1,920
Non-cash cost of stock option plans and other non-cash items 8,689 8,689 19,693 12,014
Impairment losses/(reversals) on investments 962,878 962,878 (157,456) (157,456)
Fair value adjustment to equity swaps on Fiat and Fiat Industrial shares (31,640) (31,640) 109,920 109,920
Losses/(gains) on disposals -(14,703) (14,703)
Change in provisions for employee benefits and other provisions 1,547 6,774 2,311 (5,859)
Change in deferred taxes 4,051 1,145
Change in working capital 3,496 62,730 23,701 43,629
TOTAL 798,675 85,687
C) CASH FROM/(USED IN) INVESTING ACTIVITIES:
Investments relating to:
Recapitalization of subsidiaries (444,000) (444,000) (220,000) (220,000)
Acquisitions (130,852) (130,852) (122,399)
Reductions in investments relating to:
Proceeds from disposals -76,947 76,947
Other (investments)/disposals, net (1,030) (3,271) (130)
TOTAL (575,882) (268,723)
D) CASH FROM/(USED IN) FINANCING ACTIVITIES:
Change in current financial assets 336,478 336,478 (153,231) (153,231)
Proceeds from non-current debt and other changes 400,000 400,000 -
Repayment of non-current debt (1,150,000) (1,150,000) (400,000) (400,000)
Change in current debt 230,329 227,715 883,270 883,270
Increase in share capital -5,142
Purchases of own shares (34) -
Sales of own shares --
Dividends paid (39,756) (10,800) (151,651) (40,300)
TOTAL (222,983) 183,530
E) NET CHANGE IN CASH AND CASH EQUIVALENTS (190) 504
F) CASH AND CASH EQUIVALENTS AT END OF YEAR 554 744