Chrysler 2012 Annual Report Download - page 158
Download and view the complete annual report
Please find page 158 of the 2012 Chrysler annual report below. You can navigate through the pages in the report by either clicking on the pages listed below, or by using the keyword search tool below to find specific information within the annual report.-
 1
1 -
2
-
3
-
4
-
5
-
6
-
7
-
8
-
9
-
10
-
11
-
12
-
13
-
14
-
15
-
16
-
17
-
18
-
19
-
20
-
21
-
22
-
23
-
24
-
25
-
26
-
27
-
28
-
29
-
30
-
31
-
32
-
33
-
34
-
35
-
36
-
37
-
38
-
39
-
40
-
41
-
42
-
43
-
44
-
45
-
46
-
47
-
48
-
49
-
50
-
51
-
52
-
53
-
54
-
55
-
56
-
57
-
58
-
59
-
60
-
61
-
62
-
63
-
64
-
65
-
66
-
67
-
68
-
69
-
70
-
71
-
72
-
73
-
74
-
75
-
76
-
77
-
78
-
79
-
80
-
81
-
82
-
83
-
84
-
85
-
86
-
87
-
88
-
89
-
90
-
91
-
92
-
93
-
94
-
95
-
96
-
97
-
98
-
99
-
100
-
101
-
102
-
103
-
104
-
105
-
106
-
107
-
108
-
109
-
110
-
111
-
112
-
113
-
114
-
115
-
116
-
117
-
118
-
119
-
120
-
121
-
122
-
123
-
124
-
125
-
126
-
127
-
128
-
129
-
130
-
131
-
132
-
133
-
134
-
135
-
136
-
137
-
138
-
139
-
140
-
141
-
142
-
143
-
144
-
145
-
146
-
147
-
 148
148 -
 149
149 -
 150
150 -
 151
151 -
 152
152 -
 153
153 -
 154
154 -
 155
155 -
 156
156 -
 157
157 -
 158
158 -
 159
159 -
 160
160 -
 161
161 -
 162
162 -
 163
163 -
 164
164 -
 165
165 -
 166
166 -
 167
167 -
 168
168 -
169
-
170
-
171
-
172
-
173
-
174
-
175
-
176
-
177
-
178
-
179
-
180
-
181
-
182
-
183
-
184
-
185
-
186
-
187
-
188
-
189
-
190
-
191
-
192
-
193
-
194
-
195
-
196
-
197
-
198
-
199
-
200
-
201
-
202
-
203
-
204
-
205
-
206
-
207
-
208
-
209
-
210
-
211
-
212
-
213
-
214
-
215
-
216
-
217
-
218
-
219
-
220
-
221
-
222
-
223
-
224
-
225
-
226
-
227
-
228
-
229
-
230
-
231
-
232
-
233
-
234
-
235
-
236
-
237
-
238
-
239
-
240
-
241
-
242
-
243
-
244
-
245
-
246
-
247
-
248
-
249
-
250
-
251
-
252
-
253
-
254
-
255
-
256
-
257
-
258
-
259
-
260
-
261
-
262
-
263
-
264
-
265
-
266
-
267
-
268
-
269
-
270
-
271
-
272
-
273
-
274
-
275
-
276
-
277
-
278
-
279
-
280
-
281
-
282
-
283
-
284
-
285
-
286
-
287
-
288
-
289
-
290
-
291
-
292
-
293
-
294
-
295
-
296
-
297
-
298
-
299
-
300
-
301
-
302
-
303
-
304
-
305
-
306
-
307
-
308
-
309
-
310
-
311
-
312
-
313
-
314
-
315
-
316
-
317
-
318
-
319
-
320
-
321
-
322
-
323
-
324
-
325
-
326
-
327
-
328
-
329
-
330
-
331
-
332
-
333
-
334
-
335
-
336
-
337
-
338
-
339
-
340
-
341
-
342
-
343
-
344
-
345
-
346
 |
 |

157
Consolidated
Financial Statements
at 31 December 2012
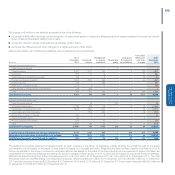
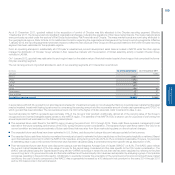
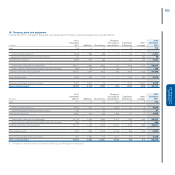
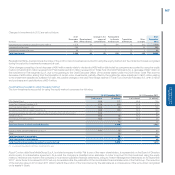
The earnings/(loss) per share, for 2012, that follows takes into account the above-mentioned conversion by dividing the Profit/(loss) attributable to the equity
holders of the parent company, by the weighted average number of ordinary shares outstanding during the period (assuming conversion occurred at the
beginning of the year). In order to calculate the earnings/(loss) per share for 2011, which is presented for comparative purposes, the three different classes
of shares, together with their different dividend rights have been taken into account. For this purpose, the Profit/(loss) attributable to the equity holders of
the parent company had been adjusted by the amount of the dividends that would be contractually due to each class of shares in the theoretical event of
a total distribution of profits. For this purpose, the amount allocated to each class of shares was then divided by the weighted average number of shares
for the period.
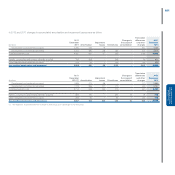
The following table provides amounts used in calculation of earnings/(loss) per share for the two periods:
2012 2011
Ordinary
shares
Ordinary
shares
Preference
shares
Saving
shares Total
Profit/(loss) attributable to owners of the parent € million 348 1,334
Theoretical preference right € million -- 23 17 40
Profit/(loss) attributable to all classes of shares € million -1,129 88 77 1,294
Profit/(loss) attributable to each class of shares € million 348 1,129 111 94 1,334
Average number of shares outstanding thousand 1,215,828 1,054,007 103,292 79,913 1,237,212
Basic earnings/(loss) per share €0.286 1.071 1.071 1.180
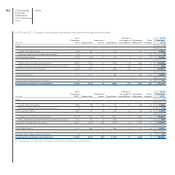
If all the preference and savings shares had been converted at the beginning of 2011 at the above-mentioned conditions, earnings per ordinary share for
2011 would have been €1.101.
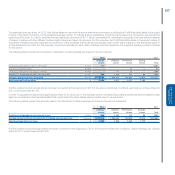
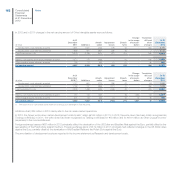
In order to calculate the diluted earnings/(loss) per share for 2012 and 2011, the average number of outstanding ordinary shares has been increased to also
take into consideration the theoretical effect that would arise if the share based payment plans were to be exercised.
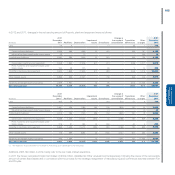
The following tables present the amounts used in the calculation of diluted earnings per share for the periods presented:
2012 2011
Ordinary
shares
Ordinary
shares
Preference
shares
Savings
shares Total
Profit/(loss) attributable to each class of shares € million 348 1,129 111 94 1,334
Average number of shares considered for the diluted earnings per share thousands 1,225,868 1,063,684 103,292 79,913 1,246,889
Diluted earnings/(loss) per share € 0.284 1.063 1.063 1.172
If all the preference and savings shares had been converted at the beginning of 2011 at the above-mentioned conditions, diluted earnings per ordinary
share for 2011 would have been €1.093.