Chrysler 2012 Annual Report Download - page 214
Download and view the complete annual report
Please find page 214 of the 2012 Chrysler annual report below. You can navigate through the pages in the report by either clicking on the pages listed below, or by using the keyword search tool below to find specific information within the annual report.-
 1
1 -
2
-
3
-
4
-
5
-
6
-
7
-
8
-
9
-
10
-
11
-
12
-
13
-
14
-
15
-
16
-
17
-
18
-
19
-
20
-
21
-
22
-
23
-
24
-
25
-
26
-
27
-
28
-
29
-
30
-
31
-
32
-
33
-
34
-
35
-
36
-
37
-
38
-
39
-
40
-
41
-
42
-
43
-
44
-
45
-
46
-
47
-
48
-
49
-
50
-
51
-
52
-
53
-
54
-
55
-
56
-
57
-
58
-
59
-
60
-
61
-
62
-
63
-
64
-
65
-
66
-
67
-
68
-
69
-
70
-
71
-
72
-
73
-
74
-
75
-
76
-
77
-
78
-
79
-
80
-
81
-
82
-
83
-
84
-
85
-
86
-
87
-
88
-
89
-
90
-
91
-
92
-
93
-
94
-
95
-
96
-
97
-
98
-
99
-
100
-
101
-
102
-
103
-
104
-
105
-
106
-
107
-
108
-
109
-
110
-
111
-
112
-
113
-
114
-
115
-
116
-
117
-
118
-
119
-
120
-
121
-
122
-
123
-
124
-
125
-
126
-
127
-
128
-
129
-
130
-
131
-
132
-
133
-
134
-
135
-
136
-
137
-
138
-
139
-
140
-
141
-
142
-
143
-
144
-
145
-
146
-
147
-
148
-
149
-
150
-
151
-
152
-
153
-
154
-
155
-
156
-
157
-
158
-
159
-
160
-
161
-
162
-
163
-
164
-
165
-
166
-
167
-
168
-
169
-
170
-
171
-
172
-
173
-
174
-
175
-
176
-
177
-
178
-
179
-
180
-
181
-
182
-
183
-
184
-
185
-
186
-
187
-
188
-
189
-
190
-
191
-
192
-
193
-
194
-
195
-
196
-
197
-
198
-
199
-
200
-
201
-
202
-
203
-
 204
204 -
 205
205 -
 206
206 -
 207
207 -
 208
208 -
 209
209 -
 210
210 -
 211
211 -
 212
212 -
 213
213 -
 214
214 -
 215
215 -
 216
216 -
 217
217 -
 218
218 -
 219
219 -
 220
220 -
 221
221 -
 222
222 -
 223
223 -
 224
224 -
225
-
226
-
227
-
228
-
229
-
230
-
231
-
232
-
233
-
234
-
235
-
236
-
237
-
238
-
239
-
240
-
241
-
242
-
243
-
244
-
245
-
246
-
247
-
248
-
249
-
250
-
251
-
252
-
253
-
254
-
255
-
256
-
257
-
258
-
259
-
260
-
261
-
262
-
263
-
264
-
265
-
266
-
267
-
268
-
269
-
270
-
271
-
272
-
273
-
274
-
275
-
276
-
277
-
278
-
279
-
280
-
281
-
282
-
283
-
284
-
285
-
286
-
287
-
288
-
289
-
290
-
291
-
292
-
293
-
294
-
295
-
296
-
297
-
298
-
299
-
300
-
301
-
302
-
303
-
304
-
305
-
306
-
307
-
308
-
309
-
310
-
311
-
312
-
313
-
314
-
315
-
316
-
317
-
318
-
319
-
320
-
321
-
322
-
323
-
324
-
325
-
326
-
327
-
328
-
329
-
330
-
331
-
332
-
333
-
334
-
335
-
336
-
337
-
338
-
339
-
340
-
341
-
342
-
343
-
344
-
345
-
346
 |
 |

213
Consolidated
Financial Statements
at 31 December 2012
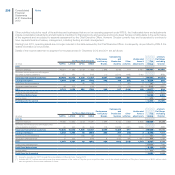
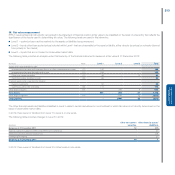
36. Fair value measurement
IFRS 7 requires financial instruments recognised in the statement of financial position at fair value to be classified on the basis of a hierarchy that reflects the
significance of the inputs used in determining fair value. The following levels are used in this hierarchy:
Level 1 – quoted prices in active markets for the assets or liabilities being measured;
Level 2 – inputs other than quoted prices included within Level 1 that are observable for the asset or liability, either directly (as prices) or indirectly (derived
from prices) on the market;
Level 3 – inputs that are not based on observable market data.
The following table provides an analysis under this hierarchy of the financial instruments measured at fair value at 31 December 2012:
(€ million) Note Level 1 Level 2 Level 3 Total
Assets at fair value available for sale:
Investments at fair value with changes directly in other comprehensive income (17) 142 - - 142
Investments at fair value through profit or loss (17) 153 - - 153
Other non-current securities (17) 48 - 12 60
Current securities available-for-sale (20) 83 - - 83
Financial assets at fair value held-for-trading:
Current investments 32 - - 32
Current securities held for trading (20) 173 - - 173
Other financial assets (21) - 492 9 501
Total Assets 631 492 21 1,144
Other financial liabilities (21) - (199) (2) (201)
Total Liabilities - (199) (2) (201)
The other financial assets and liabilities classified in Level 3 relate to certain derivatives on commodities for which fair value is not directly determined on the
basis of observable market data.
In 2012, there were no transfers from Level 1 to Level 2 or vice versa.
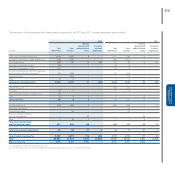
The following table provides changes in Level 3 in 2012:
(€ million)
Other non-current
securities
Other financial assets/
(liabilities)
Balances at 31 December 2011 12 (27)
Gains/(Losses) recognised in Other comprehensive income/(loss) - 40
(Gains)/Losses recognised in profit or loss - (28)
Increases/(Decreases) - 22
Balances at 31 December 2012 12 7
In 2012, there were no transfers from Level 3 to other levels or vice versa.