Chrysler 2012 Annual Report Download - page 59
Download and view the complete annual report
Please find page 59 of the 2012 Chrysler annual report below. You can navigate through the pages in the report by either clicking on the pages listed below, or by using the keyword search tool below to find specific information within the annual report.-
 1
1 -
2
-
3
-
4
-
5
-
6
-
7
-
8
-
9
-
10
-
11
-
12
-
13
-
14
-
15
-
16
-
17
-
18
-
19
-
20
-
21
-
22
-
23
-
24
-
25
-
26
-
27
-
28
-
29
-
30
-
31
-
32
-
33
-
34
-
35
-
36
-
37
-
38
-
39
-
40
-
41
-
42
-
43
-
44
-
45
-
46
-
47
-
48
-
 49
49 -
 50
50 -
 51
51 -
 52
52 -
 53
53 -
 54
54 -
 55
55 -
 56
56 -
 57
57 -
 58
58 -
 59
59 -
 60
60 -
 61
61 -
 62
62 -
 63
63 -
 64
64 -
 65
65 -
 66
66 -
 67
67 -
 68
68 -
 69
69 -
70
-
71
-
72
-
73
-
74
-
75
-
76
-
77
-
78
-
79
-
80
-
81
-
82
-
83
-
84
-
85
-
86
-
87
-
88
-
89
-
90
-
91
-
92
-
93
-
94
-
95
-
96
-
97
-
98
-
99
-
100
-
101
-
102
-
103
-
104
-
105
-
106
-
107
-
108
-
109
-
110
-
111
-
112
-
113
-
114
-
115
-
116
-
117
-
118
-
119
-
120
-
121
-
122
-
123
-
124
-
125
-
126
-
127
-
128
-
129
-
130
-
131
-
132
-
133
-
134
-
135
-
136
-
137
-
138
-
139
-
140
-
141
-
142
-
143
-
144
-
145
-
146
-
147
-
148
-
149
-
150
-
151
-
152
-
153
-
154
-
155
-
156
-
157
-
158
-
159
-
160
-
161
-
162
-
163
-
164
-
165
-
166
-
167
-
168
-
169
-
170
-
171
-
172
-
173
-
174
-
175
-
176
-
177
-
178
-
179
-
180
-
181
-
182
-
183
-
184
-
185
-
186
-
187
-
188
-
189
-
190
-
191
-
192
-
193
-
194
-
195
-
196
-
197
-
198
-
199
-
200
-
201
-
202
-
203
-
204
-
205
-
206
-
207
-
208
-
209
-
210
-
211
-
212
-
213
-
214
-
215
-
216
-
217
-
218
-
219
-
220
-
221
-
222
-
223
-
224
-
225
-
226
-
227
-
228
-
229
-
230
-
231
-
232
-
233
-
234
-
235
-
236
-
237
-
238
-
239
-
240
-
241
-
242
-
243
-
244
-
245
-
246
-
247
-
248
-
249
-
250
-
251
-
252
-
253
-
254
-
255
-
256
-
257
-
258
-
259
-
260
-
261
-
262
-
263
-
264
-
265
-
266
-
267
-
268
-
269
-
270
-
271
-
272
-
273
-
274
-
275
-
276
-
277
-
278
-
279
-
280
-
281
-
282
-
283
-
284
-
285
-
286
-
287
-
288
-
289
-
290
-
291
-
292
-
293
-
294
-
295
-
296
-
297
-
298
-
299
-
300
-
301
-
302
-
303
-
304
-
305
-
306
-
307
-
308
-
309
-
310
-
311
-
312
-
313
-
314
-
315
-
316
-
317
-
318
-
319
-
320
-
321
-
322
-
323
-
324
-
325
-
326
-
327
-
328
-
329
-
330
-
331
-
332
-
333
-
334
-
335
-
336
-
337
-
338
-
339
-
340
-
341
-
342
-
343
-
344
-
345
-
346
 |
 |
58
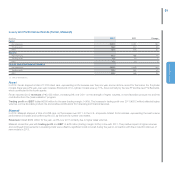
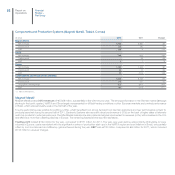
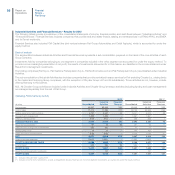
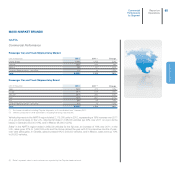
Luxury and Performance Brands (Ferrari)
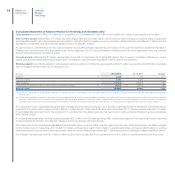
Ferrari Financial Services (“FFS”) provides car financing to customers in several European countries (Germany, the United Kingdom, Switzerland, France,
Belgium, Austria and Italy) through its subsidiaries FFS S.p.A. and FFS AG, and in the United States and Canada through the subsidiary FFS Inc.
FFS Japan KK, a wholly-owned subsidiary of FFS S.p.A. incorporated in September 2011 and located in Tokyo, commenced operations in the third quarter
of 2012 with dealer finance and intercompany factoring activities (financing to end customers will begin in the first quarter of 2013).
The Dealer Finance business line, launched in December 2009, currently serves the networks in Europe (Germany, Switzerland, Belgium, the UK and Italy),
the U.S. and Japan.
FFS reported consolidated revenues of approximately €47 million for the year, up 57% over 2011, due to higher volumes financed in the U.S. and Europe.
Trading profit was €15 million, up €5 million on 2011.
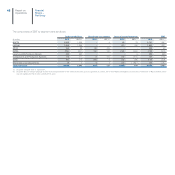
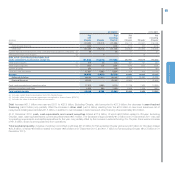
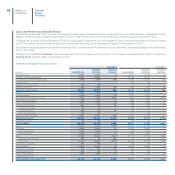
Statement of Financial Position by Activity
31.12.2012 31.12.2011
(€ million) Consolidated
Industrial
Activities
Financial
Services Consolidated
Industrial
Activities
Financial
Services
Intangible assets 19,284 19,279 5 18,200 18,196 4
Property, plant and equipment 22,061 22,058 3 20,785 20,781 4
Investments and other financial assets 2,290 2,759 789 2,660 3,097 755
Leased assets 1 1 - 45 45 -
Defined benefit plan assets 105 105 - 97 96 1
Deferred tax assets 1,736 1,675 61 1,690 1,622 68
Total non-current assets 45,477 45,877 858 43,477 43,837 832
Inventory 9,295 9,290 5 9,123 9,116 7
Trade receivables 2,702 2,690 20 2,625 2,619 17
Receivables from financing activities 3,727 1,600 3,643 3,968 1,681 3,906
Current taxes receivable 236 237 6 369 367 4
Other current receivables 2,163 2,131 32 2,088 2,068 22
Current financial assets: 807 724 83 789 739 52
Current investments 32 32 - 33 33 -
Current securities 256 173 83 199 147 52
Other financial assets 519 519 - 557 559 -
Cash and cash equivalents 17,657 17,411 246 17,526 17,429 97
Total current assets 36,587 34,083 4,035 36,488 34,019 4,105
Assets held for sale 55 55 - 66 66 -
TOTAL ASSETS 82,119 80,015 4,893 80,031 77,922 4,937
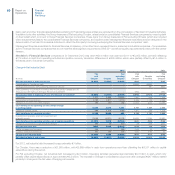
Equity 13,173 13,173 1,258 12,260 12,258 1,192
Provisions: 15,484 15,462 22 15,624 15,587 37
Employee benefits 6,694 6,689 5 7,026 7,022 4
Other provisions 8,790 8,773 17 8,598 8,565 33
Debt: 27,889 25,933 3,472 26,772 24,796 3,595
Asset-backed financing 449 52 397 710 213 497
Other debt 27,440 25,881 3,075 26,062 24,583 3,098
Other financial liabilities 201 198 3 429 428 3
Trade payables 16,558 16,546 20 16,418 16,399 32
Current taxes payable 231 223 15 230 228 5
Deferred tax liabilities 802 796 6 760 753 7
Other current liabilities 7,781 7,684 97 7,538 7,473 66
Liabilities held for sale - - - - - -
TOTAL EQUITY AND LIABILITIES 82,119 80,015 4,893 80,031 77,922 4,937
Financial
Review –
Fiat Group
Report on
Operations