Chrysler 2012 Annual Report Download - page 157
Download and view the complete annual report
Please find page 157 of the 2012 Chrysler annual report below. You can navigate through the pages in the report by either clicking on the pages listed below, or by using the keyword search tool below to find specific information within the annual report.-
 1
1 -
2
-
3
-
4
-
5
-
6
-
7
-
8
-
9
-
10
-
11
-
12
-
13
-
14
-
15
-
16
-
17
-
18
-
19
-
20
-
21
-
22
-
23
-
24
-
25
-
26
-
27
-
28
-
29
-
30
-
31
-
32
-
33
-
34
-
35
-
36
-
37
-
38
-
39
-
40
-
41
-
42
-
43
-
44
-
45
-
46
-
47
-
48
-
49
-
50
-
51
-
52
-
53
-
54
-
55
-
56
-
57
-
58
-
59
-
60
-
61
-
62
-
63
-
64
-
65
-
66
-
67
-
68
-
69
-
70
-
71
-
72
-
73
-
74
-
75
-
76
-
77
-
78
-
79
-
80
-
81
-
82
-
83
-
84
-
85
-
86
-
87
-
88
-
89
-
90
-
91
-
92
-
93
-
94
-
95
-
96
-
97
-
98
-
99
-
100
-
101
-
102
-
103
-
104
-
105
-
106
-
107
-
108
-
109
-
110
-
111
-
112
-
113
-
114
-
115
-
116
-
117
-
118
-
119
-
120
-
121
-
122
-
123
-
124
-
125
-
126
-
127
-
128
-
129
-
130
-
131
-
132
-
133
-
134
-
135
-
136
-
137
-
138
-
139
-
140
-
141
-
142
-
143
-
144
-
145
-
146
-
 147
147 -
 148
148 -
 149
149 -
 150
150 -
 151
151 -
 152
152 -
 153
153 -
 154
154 -
 155
155 -
 156
156 -
 157
157 -
 158
158 -
 159
159 -
 160
160 -
 161
161 -
 162
162 -
 163
163 -
 164
164 -
 165
165 -
 166
166 -
 167
167 -
168
-
169
-
170
-
171
-
172
-
173
-
174
-
175
-
176
-
177
-
178
-
179
-
180
-
181
-
182
-
183
-
184
-
185
-
186
-
187
-
188
-
189
-
190
-
191
-
192
-
193
-
194
-
195
-
196
-
197
-
198
-
199
-
200
-
201
-
202
-
203
-
204
-
205
-
206
-
207
-
208
-
209
-
210
-
211
-
212
-
213
-
214
-
215
-
216
-
217
-
218
-
219
-
220
-
221
-
222
-
223
-
224
-
225
-
226
-
227
-
228
-
229
-
230
-
231
-
232
-
233
-
234
-
235
-
236
-
237
-
238
-
239
-
240
-
241
-
242
-
243
-
244
-
245
-
246
-
247
-
248
-
249
-
250
-
251
-
252
-
253
-
254
-
255
-
256
-
257
-
258
-
259
-
260
-
261
-
262
-
263
-
264
-
265
-
266
-
267
-
268
-
269
-
270
-
271
-
272
-
273
-
274
-
275
-
276
-
277
-
278
-
279
-
280
-
281
-
282
-
283
-
284
-
285
-
286
-
287
-
288
-
289
-
290
-
291
-
292
-
293
-
294
-
295
-
296
-
297
-
298
-
299
-
300
-
301
-
302
-
303
-
304
-
305
-
306
-
307
-
308
-
309
-
310
-
311
-
312
-
313
-
314
-
315
-
316
-
317
-
318
-
319
-
320
-
321
-
322
-
323
-
324
-
325
-
326
-
327
-
328
-
329
-
330
-
331
-
332
-
333
-
334
-
335
-
336
-
337
-
338
-
339
-
340
-
341
-
342
-
343
-
344
-
345
-
346
 |
 |

Notes
156 Consolidated
Financial
Statements
at 31 December
2012
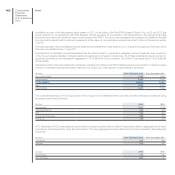
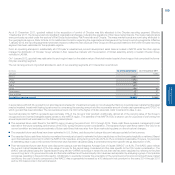
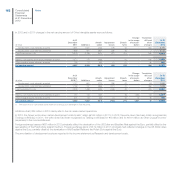
In particular, at 31 December 2012 Deferred tax assets, net of Deferred tax liabilities, include tax benefits arising from unused tax losses of €929 million
(€783 million at 31 December 2011). At 31 December 2012, further tax benefits arising from unused tax losses amounting to €2,470 million have not been
recognised. At 31 December 2011 the corresponding item was €2,432 million.
Deferred taxes have not been provided on the undistributed earnings of subsidiaries, except in cases where it is probable they will be distributed in the
foreseeable future.
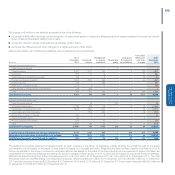
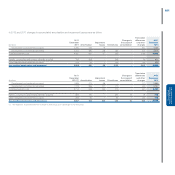
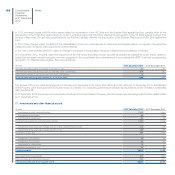
The totals of deductible and taxable temporary differences and accumulated tax losses at 31 December 2012, together with the amounts for which deferred
tax assets have not been recognised, analysed by year of expiry, are as follows:
Year of expiry
(€ million)
At 31
December
2012 2013 2014 2015 2016
Beyond
2016
Unlimited/
indeterminable
Temporary differences and tax losses relating to State taxation
(IRES in the case of Italy):
Deductible temporary differences 19,013 4,869 2,241 2,098 2,144 7,661 -
Taxable temporary differences (11,011) (1,642) (1,348) (1,215) (1,222) (4,155) (1,429)
Tax losses 11,906 42 37 28 257 1,745 9,797
Temporary differences and tax losses for which
deferred tax assets have not been recognised (16,228) (2,038) (813) (707) (604) (3,290) (8,776)
Temporary differences and tax losses relating
to State taxation 3,680 1,231 117 204 575 1,961 (408)
Temporary differences and tax losses relating to local taxation
(IRAP in the case of Italy):
Deductible temporary differences 17,714 3,357 2,257 2,158 2,116 7,826 -
Taxable temporary differences (12,166) (1,551) (1,364) (1,307) (1,327) (5,100) (1,517)
Tax losses 1,702 24 21 14 13 835 795
Temporary differences and tax losses for which deferred tax
assets have not been recognised (7,185) (869) (807) (795) (775) (3,168) (771)
Temporary differences and tax losses relating
to local taxation 65 961 107 70 27 393 (1,493)
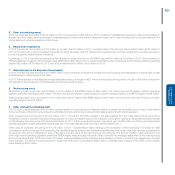
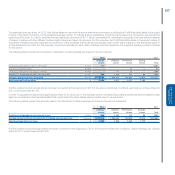
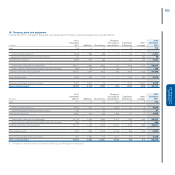
12. Other information by nature
In 2012 the income statement includes personnel costs of €8,116 million (€6,320 million in 2011).
In 2012, Fiat Group had an average number of employees of 205,112 (195,404 employees in 2011), whom 143,727 (140,216 employees in 2011) work for
the Fiat Group excluding Chrysler and 61,385 (an average of 55,188 employees calculated for the period June-December 2011) work for Chrysler.
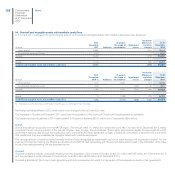
13. Earnings/(loss) per share
As explained in Note 24 below, until 21 May 2012 the share capital of Fiat S.p.A. was represented by three classes of shares (ordinary shares, preference
shares and savings shares) each of which had different dividend rights. In accordance with the resolution adopted at the extraordinary session of
Shareholders’ General Meeting of 4 April 2012, as all the necessary conditions precedent had been satisfied, the mandatory conversion of all 103,292,310
Fiat S.p.A. preference shares and 79,912,800 Fiat S.p.A. savings shares into 157,722,163 Fiat S.p.A. ordinary shares, with dividend rights from 2012, took
place on 21 May 2012. The conversion ratio was 0.850 ordinary shares per preference share and 0.875 ordinary shares per savings share.