Chrysler 2012 Annual Report Download - page 16
Download and view the complete annual report
Please find page 16 of the 2012 Chrysler annual report below. You can navigate through the pages in the report by either clicking on the pages listed below, or by using the keyword search tool below to find specific information within the annual report.-
 1
1 -
2
-
3
-
4
-
5
-
 6
6 -
 7
7 -
 8
8 -
 9
9 -
 10
10 -
 11
11 -
 12
12 -
 13
13 -
 14
14 -
 15
15 -
 16
16 -
 17
17 -
 18
18 -
 19
19 -
 20
20 -
 21
21 -
 22
22 -
 23
23 -
 24
24 -
 25
25 -
 26
26 -
27
-
28
-
29
-
30
-
31
-
32
-
33
-
34
-
35
-
36
-
37
-
38
-
39
-
40
-
41
-
42
-
43
-
44
-
45
-
46
-
47
-
48
-
49
-
50
-
51
-
52
-
53
-
54
-
55
-
56
-
57
-
58
-
59
-
60
-
61
-
62
-
63
-
64
-
65
-
66
-
67
-
68
-
69
-
70
-
71
-
72
-
73
-
74
-
75
-
76
-
77
-
78
-
79
-
80
-
81
-
82
-
83
-
84
-
85
-
86
-
87
-
88
-
89
-
90
-
91
-
92
-
93
-
94
-
95
-
96
-
97
-
98
-
99
-
100
-
101
-
102
-
103
-
104
-
105
-
106
-
107
-
108
-
109
-
110
-
111
-
112
-
113
-
114
-
115
-
116
-
117
-
118
-
119
-
120
-
121
-
122
-
123
-
124
-
125
-
126
-
127
-
128
-
129
-
130
-
131
-
132
-
133
-
134
-
135
-
136
-
137
-
138
-
139
-
140
-
141
-
142
-
143
-
144
-
145
-
146
-
147
-
148
-
149
-
150
-
151
-
152
-
153
-
154
-
155
-
156
-
157
-
158
-
159
-
160
-
161
-
162
-
163
-
164
-
165
-
166
-
167
-
168
-
169
-
170
-
171
-
172
-
173
-
174
-
175
-
176
-
177
-
178
-
179
-
180
-
181
-
182
-
183
-
184
-
185
-
186
-
187
-
188
-
189
-
190
-
191
-
192
-
193
-
194
-
195
-
196
-
197
-
198
-
199
-
200
-
201
-
202
-
203
-
204
-
205
-
206
-
207
-
208
-
209
-
210
-
211
-
212
-
213
-
214
-
215
-
216
-
217
-
218
-
219
-
220
-
221
-
222
-
223
-
224
-
225
-
226
-
227
-
228
-
229
-
230
-
231
-
232
-
233
-
234
-
235
-
236
-
237
-
238
-
239
-
240
-
241
-
242
-
243
-
244
-
245
-
246
-
247
-
248
-
249
-
250
-
251
-
252
-
253
-
254
-
255
-
256
-
257
-
258
-
259
-
260
-
261
-
262
-
263
-
264
-
265
-
266
-
267
-
268
-
269
-
270
-
271
-
272
-
273
-
274
-
275
-
276
-
277
-
278
-
279
-
280
-
281
-
282
-
283
-
284
-
285
-
286
-
287
-
288
-
289
-
290
-
291
-
292
-
293
-
294
-
295
-
296
-
297
-
298
-
299
-
300
-
301
-
302
-
303
-
304
-
305
-
306
-
307
-
308
-
309
-
310
-
311
-
312
-
313
-
314
-
315
-
316
-
317
-
318
-
319
-
320
-
321
-
322
-
323
-
324
-
325
-
326
-
327
-
328
-
329
-
330
-
331
-
332
-
333
-
334
-
335
-
336
-
337
-
338
-
339
-
340
-
341
-
342
-
343
-
344
-
345
-
346
 |
 |

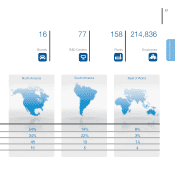
15
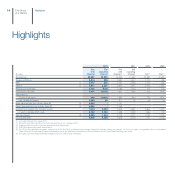
The Group at a Glance
2012 2011 (1) 2010 (2)
Employees (no.) 214,836 197,021 189,424
of which women (%) 19.2 17.9 17.8
Hours of training (thousands) 4,206 4,048 3,196
Frequency rate of accidents (no. accidents per 100,000 hours worked) 0.22 0.28 0.44
Severity rate of accidents (no. days of absence due to accidents per 1,000 hours worked) 0.07 0.08 0.13
Plant energy consumption (3) (TeraJoules) 45,692 48,875 49,722
CO2 emissions of plants (3) (thousands of tons) 3,965 4,196 4,383
Water withdrawal of plants (thousands of m3)25,874 29,862 34,198
Waste generated by plants (thousands of tons) 1,761 1,855 1,712
Contributions to local communities (4) (€ million) 20.8 36.5 25.6
Note: All information has been audited by the independent certification organization SGS Italia S.p.A. The scope, methodology, limitations and conclusions of the audit are provided in the
Assurance Statement issued by SGS and published in the Fiat Group 2012 Sustainability Report.
(1) Includes Chrysler Group for the full year.
(2) Restated to include Chrysler Group and exclude companies transferred to Fiat Industrial S.p.A. on 1 January 2011.
(3) Data for 2011 and 2010 has been recalculated based on the scope of reporting applicable for 2012.
(4) Includes initiatives undertaken by the Group worldwide in support of local communities. Calculation based on London Benchmarking Group (LBG) method.
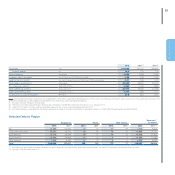
Selected Data by Region
Employees Plants R&D Centers
Revenues (*)
(€ million)
2012 2011 2012 2011 2012 2011 2012 2011 (**)
Italy 61,858 62,583 44 46 37 38 7,275 9,258
Europe (excluding Italy) 26,767 25,140 33 33 15 14 12,999 13,720
North America 73,713 60,348 48 47 16 16 45,348 21,505
South America 46,949 44,668 19 19 5511,805 11,383
Other Regions 5,549 4,282 14 10 446,530 3,693
Total 214,836 197,021 158 155 77 77 83,957 59,559
(*) In addition to mass-market brands, revenues for each region also include Luxury and Performance brands, as well as Components and Productions Systems.
(**) Includes Chrysler from June 2011.