Chrysler 2012 Annual Report Download - page 52
Download and view the complete annual report
Please find page 52 of the 2012 Chrysler annual report below. You can navigate through the pages in the report by either clicking on the pages listed below, or by using the keyword search tool below to find specific information within the annual report.-
 1
1 -
2
-
3
-
4
-
5
-
6
-
7
-
8
-
9
-
10
-
11
-
12
-
13
-
14
-
15
-
16
-
17
-
18
-
19
-
20
-
21
-
22
-
23
-
24
-
25
-
26
-
27
-
28
-
29
-
30
-
31
-
32
-
33
-
34
-
35
-
36
-
37
-
38
-
39
-
40
-
41
-
 42
42 -
 43
43 -
 44
44 -
 45
45 -
 46
46 -
 47
47 -
 48
48 -
 49
49 -
 50
50 -
 51
51 -
 52
52 -
 53
53 -
 54
54 -
 55
55 -
 56
56 -
 57
57 -
 58
58 -
 59
59 -
 60
60 -
 61
61 -
 62
62 -
63
-
64
-
65
-
66
-
67
-
68
-
69
-
70
-
71
-
72
-
73
-
74
-
75
-
76
-
77
-
78
-
79
-
80
-
81
-
82
-
83
-
84
-
85
-
86
-
87
-
88
-
89
-
90
-
91
-
92
-
93
-
94
-
95
-
96
-
97
-
98
-
99
-
100
-
101
-
102
-
103
-
104
-
105
-
106
-
107
-
108
-
109
-
110
-
111
-
112
-
113
-
114
-
115
-
116
-
117
-
118
-
119
-
120
-
121
-
122
-
123
-
124
-
125
-
126
-
127
-
128
-
129
-
130
-
131
-
132
-
133
-
134
-
135
-
136
-
137
-
138
-
139
-
140
-
141
-
142
-
143
-
144
-
145
-
146
-
147
-
148
-
149
-
150
-
151
-
152
-
153
-
154
-
155
-
156
-
157
-
158
-
159
-
160
-
161
-
162
-
163
-
164
-
165
-
166
-
167
-
168
-
169
-
170
-
171
-
172
-
173
-
174
-
175
-
176
-
177
-
178
-
179
-
180
-
181
-
182
-
183
-
184
-
185
-
186
-
187
-
188
-
189
-
190
-
191
-
192
-
193
-
194
-
195
-
196
-
197
-
198
-
199
-
200
-
201
-
202
-
203
-
204
-
205
-
206
-
207
-
208
-
209
-
210
-
211
-
212
-
213
-
214
-
215
-
216
-
217
-
218
-
219
-
220
-
221
-
222
-
223
-
224
-
225
-
226
-
227
-
228
-
229
-
230
-
231
-
232
-
233
-
234
-
235
-
236
-
237
-
238
-
239
-
240
-
241
-
242
-
243
-
244
-
245
-
246
-
247
-
248
-
249
-
250
-
251
-
252
-
253
-
254
-
255
-
256
-
257
-
258
-
259
-
260
-
261
-
262
-
263
-
264
-
265
-
266
-
267
-
268
-
269
-
270
-
271
-
272
-
273
-
274
-
275
-
276
-
277
-
278
-
279
-
280
-
281
-
282
-
283
-
284
-
285
-
286
-
287
-
288
-
289
-
290
-
291
-
292
-
293
-
294
-
295
-
296
-
297
-
298
-
299
-
300
-
301
-
302
-
303
-
304
-
305
-
306
-
307
-
308
-
309
-
310
-
311
-
312
-
313
-
314
-
315
-
316
-
317
-
318
-
319
-
320
-
321
-
322
-
323
-
324
-
325
-
326
-
327
-
328
-
329
-
330
-
331
-
332
-
333
-
334
-
335
-
336
-
337
-
338
-
339
-
340
-
341
-
342
-
343
-
344
-
345
-
346
 |
 |

51
Report on Operations
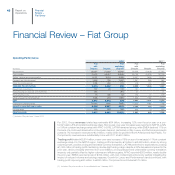
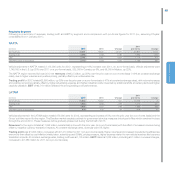
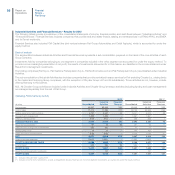
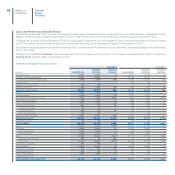
Luxury and Performance Brands (Ferrari, Maserati)
(€ million) 2012 2011 Change
Ferrari
Net revenues 2,433 2,251 182
Trading profit 350 312 38
EBIT 350 318 32
Maserati
Net revenues 634 588 46
Trading profit 42 40 2
EBIT 42 40 2
LUXURY AND PERFORMANCE BRANDS
Net revenues (*) 2,898 2,699 199
Trading profit 392 352 40
EBIT 392 358 34
(*) Net of eliminations.
Ferrari
In 2012, Ferrari shipped a total of 7,318 street cars, representing a 5% increase over the prior year and an all-time record for the brand. For 8-cylinder
models, there was a 3% year-over-year increase. Shipments of 12-cylinder models were up 11%, driven primarily by the new FF and the new F12 Berlinetta,
which contributed in the fourth quarter.
Ferrari reported 2012 revenues of €2,433 million, increasing 8% over 2011 on the strength of higher volumes, a more favorable product mix and the
contribution from the “personalization” program.
Trading profit and EBIT totaled €350 million for the year (trading margin: 14.4%). The increase in trading profit over 2011 (€312 million) reflected higher
volumes, a more favorable product mix and positive contributions from licensing and financial services.
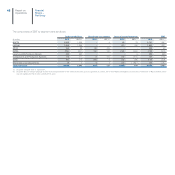
Maserati
In 2012, Maserati shipped a total of 6,288 cars, a 2% increase over 2011. In the U.S., shipments totaled 2,904 vehicles, representing the best volume
performance in 8 years and confirming the U.S. as the brand’s number one market.
Revenues totaled €634 million for the year, up 8% over 2011 primarily due to higher sales volumes.
Maserati closed the year with trading profit and EBIT of €42 million (trading margin: 6.6%), in line with 2011. The positive impact of higher volumes
and continued improvements in operating costs were offset by significant costs incurred during the year in connection with the production start-up of
new models in 2013.