Chrysler 2012 Annual Report Download - page 62
Download and view the complete annual report
Please find page 62 of the 2012 Chrysler annual report below. You can navigate through the pages in the report by either clicking on the pages listed below, or by using the keyword search tool below to find specific information within the annual report.-
 1
1 -
2
-
3
-
4
-
5
-
6
-
7
-
8
-
9
-
10
-
11
-
12
-
13
-
14
-
15
-
16
-
17
-
18
-
19
-
20
-
21
-
22
-
23
-
24
-
25
-
26
-
27
-
28
-
29
-
30
-
31
-
32
-
33
-
34
-
35
-
36
-
37
-
38
-
39
-
40
-
41
-
42
-
43
-
44
-
45
-
46
-
47
-
48
-
49
-
50
-
51
-
 52
52 -
 53
53 -
 54
54 -
 55
55 -
 56
56 -
 57
57 -
 58
58 -
 59
59 -
 60
60 -
 61
61 -
 62
62 -
 63
63 -
 64
64 -
 65
65 -
 66
66 -
 67
67 -
 68
68 -
 69
69 -
 70
70 -
 71
71 -
 72
72 -
73
-
74
-
75
-
76
-
77
-
78
-
79
-
80
-
81
-
82
-
83
-
84
-
85
-
86
-
87
-
88
-
89
-
90
-
91
-
92
-
93
-
94
-
95
-
96
-
97
-
98
-
99
-
100
-
101
-
102
-
103
-
104
-
105
-
106
-
107
-
108
-
109
-
110
-
111
-
112
-
113
-
114
-
115
-
116
-
117
-
118
-
119
-
120
-
121
-
122
-
123
-
124
-
125
-
126
-
127
-
128
-
129
-
130
-
131
-
132
-
133
-
134
-
135
-
136
-
137
-
138
-
139
-
140
-
141
-
142
-
143
-
144
-
145
-
146
-
147
-
148
-
149
-
150
-
151
-
152
-
153
-
154
-
155
-
156
-
157
-
158
-
159
-
160
-
161
-
162
-
163
-
164
-
165
-
166
-
167
-
168
-
169
-
170
-
171
-
172
-
173
-
174
-
175
-
176
-
177
-
178
-
179
-
180
-
181
-
182
-
183
-
184
-
185
-
186
-
187
-
188
-
189
-
190
-
191
-
192
-
193
-
194
-
195
-
196
-
197
-
198
-
199
-
200
-
201
-
202
-
203
-
204
-
205
-
206
-
207
-
208
-
209
-
210
-
211
-
212
-
213
-
214
-
215
-
216
-
217
-
218
-
219
-
220
-
221
-
222
-
223
-
224
-
225
-
226
-
227
-
228
-
229
-
230
-
231
-
232
-
233
-
234
-
235
-
236
-
237
-
238
-
239
-
240
-
241
-
242
-
243
-
244
-
245
-
246
-
247
-
248
-
249
-
250
-
251
-
252
-
253
-
254
-
255
-
256
-
257
-
258
-
259
-
260
-
261
-
262
-
263
-
264
-
265
-
266
-
267
-
268
-
269
-
270
-
271
-
272
-
273
-
274
-
275
-
276
-
277
-
278
-
279
-
280
-
281
-
282
-
283
-
284
-
285
-
286
-
287
-
288
-
289
-
290
-
291
-
292
-
293
-
294
-
295
-
296
-
297
-
298
-
299
-
300
-
301
-
302
-
303
-
304
-
305
-
306
-
307
-
308
-
309
-
310
-
311
-
312
-
313
-
314
-
315
-
316
-
317
-
318
-
319
-
320
-
321
-
322
-
323
-
324
-
325
-
326
-
327
-
328
-
329
-
330
-
331
-
332
-
333
-
334
-
335
-
336
-
337
-
338
-
339
-
340
-
341
-
342
-
343
-
344
-
345
-
346
 |
 |

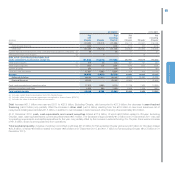
61
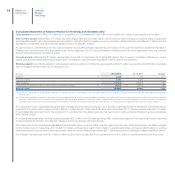
Report on Operations
Statement of Cash Flows by Activity
2012 2011 (*)
(€ million) Consolidated
Industrial
Activities
Financial
Services Consolidated
Industrial
Activities
Financial
Services
A) Cash and cash equivalents at beginning of year 17,526 17,429 97 11,967 11,705 262
B) Cash from/(used in) operating activities:
Profit/(loss) 1,411 1,411 144 1,651 1,651 131
Amortization and depreciation (net of vehicles leased out) 4,134 4,132 2 3,358 3,356 2
(Gains)/losses on disposal of non-current assets
and other non-cash items (a) 152 41 (33) (1,106) (1,200) (37)
Dividends received 89 103 - 105 149 -
Change in provisions 77 90 (13) (116) (89) (27)
Changes in deferred taxes (72) (73) 1 (19) (10) (9)
Changes relating to buy-back commitments (b) (51) (51) - (62) (62) -
Changes related to operating leases (10) (8) (2) (28) (28) -
Change in working capital 714 694 20 1,412 1,417 (5)
Total 6,444 6,339 119 5,195 5,184 55
C) Cash from/(used in) investing activities:
Investments in:
Property, plant and equipment and intangible assets
(net of vehicles leased out) (7,534) (7,530) (4) (5,528) (5,525) (3)
Subsidiaries and other equity investments (24) (26) - (142) (142) -
Cash and cash equivalents from consolidation of Chrysler net of
consideration paid for the additional 16% ownership interest - - - 5,624 5,624 -
Proceeds from the sale of non-current assets 139 139 - 449 448 1
Net change in receivables from financing activities (24) (27) 3 (1,218) 50 (1,268)
Change in current securities (64) (24) (40) (14) 4 (18)
Other changes (30) 11 (41) (29) (253) 224
Total (7,537) (7,457) (82) (858) 206 (1,064)
D) Cash from/(used in) financing activities:
Net change in debt and other financial assets/liabilities 1,679 1,536 143 (1,551) (2,446) 895
Change in net financial receivables from
Fiat Industrial Group - - - 2,761 2,759 2
Increase in share capital 22 22 2 41 41 -
(Purchase)/sale of ownership interests in subsidiaries ---(438) (438) -
Dividends paid (58) (58) (14) (181) (181) (44)
Total 1,643 1,500 131 632 (265) 853
Currency translation differences (419) (400) (19) 590 599 (9)
E) Net change in cash and cash equivalents 131 (18) 149 5,559 5,724 (165)
F) Cash and cash equivalents at end of year 17,657 17,411 246 17,526 17,429 97
(*) For 2011, includes cash flows for Chrysler from date of consolidation (1 June 2011).
(a) For 2011, the item includes reversal of the net gain of €2,017 million recognized in relation to the Chrysler transaction and reversal of unusual non-cash expense items. The item also
includes reversal of a €31 million gain (€110 million loss for 2011) in the fair value of equity swaps on a basket of Fiat S.p.A. and Fiat Industrial S.p.A. ordinary shares.
(b) Cash from vehicles sold under buy-back commitments for the periods reported above, net of amounts already recognized through profit and loss, is included in a separate line item
under operating activities, which also includes change in working capital.