Chrysler 2012 Annual Report Download - page 212
Download and view the complete annual report
Please find page 212 of the 2012 Chrysler annual report below. You can navigate through the pages in the report by either clicking on the pages listed below, or by using the keyword search tool below to find specific information within the annual report.-
 1
1 -
2
-
3
-
4
-
5
-
6
-
7
-
8
-
9
-
10
-
11
-
12
-
13
-
14
-
15
-
16
-
17
-
18
-
19
-
20
-
21
-
22
-
23
-
24
-
25
-
26
-
27
-
28
-
29
-
30
-
31
-
32
-
33
-
34
-
35
-
36
-
37
-
38
-
39
-
40
-
41
-
42
-
43
-
44
-
45
-
46
-
47
-
48
-
49
-
50
-
51
-
52
-
53
-
54
-
55
-
56
-
57
-
58
-
59
-
60
-
61
-
62
-
63
-
64
-
65
-
66
-
67
-
68
-
69
-
70
-
71
-
72
-
73
-
74
-
75
-
76
-
77
-
78
-
79
-
80
-
81
-
82
-
83
-
84
-
85
-
86
-
87
-
88
-
89
-
90
-
91
-
92
-
93
-
94
-
95
-
96
-
97
-
98
-
99
-
100
-
101
-
102
-
103
-
104
-
105
-
106
-
107
-
108
-
109
-
110
-
111
-
112
-
113
-
114
-
115
-
116
-
117
-
118
-
119
-
120
-
121
-
122
-
123
-
124
-
125
-
126
-
127
-
128
-
129
-
130
-
131
-
132
-
133
-
134
-
135
-
136
-
137
-
138
-
139
-
140
-
141
-
142
-
143
-
144
-
145
-
146
-
147
-
148
-
149
-
150
-
151
-
152
-
153
-
154
-
155
-
156
-
157
-
158
-
159
-
160
-
161
-
162
-
163
-
164
-
165
-
166
-
167
-
168
-
169
-
170
-
171
-
172
-
173
-
174
-
175
-
176
-
177
-
178
-
179
-
180
-
181
-
182
-
183
-
184
-
185
-
186
-
187
-
188
-
189
-
190
-
191
-
192
-
193
-
194
-
195
-
196
-
197
-
198
-
199
-
200
-
201
-
 202
202 -
 203
203 -
 204
204 -
 205
205 -
 206
206 -
 207
207 -
 208
208 -
 209
209 -
 210
210 -
 211
211 -
 212
212 -
 213
213 -
 214
214 -
 215
215 -
 216
216 -
 217
217 -
 218
218 -
 219
219 -
 220
220 -
 221
221 -
 222
222 -
223
-
224
-
225
-
226
-
227
-
228
-
229
-
230
-
231
-
232
-
233
-
234
-
235
-
236
-
237
-
238
-
239
-
240
-
241
-
242
-
243
-
244
-
245
-
246
-
247
-
248
-
249
-
250
-
251
-
252
-
253
-
254
-
255
-
256
-
257
-
258
-
259
-
260
-
261
-
262
-
263
-
264
-
265
-
266
-
267
-
268
-
269
-
270
-
271
-
272
-
273
-
274
-
275
-
276
-
277
-
278
-
279
-
280
-
281
-
282
-
283
-
284
-
285
-
286
-
287
-
288
-
289
-
290
-
291
-
292
-
293
-
294
-
295
-
296
-
297
-
298
-
299
-
300
-
301
-
302
-
303
-
304
-
305
-
306
-
307
-
308
-
309
-
310
-
311
-
312
-
313
-
314
-
315
-
316
-
317
-
318
-
319
-
320
-
321
-
322
-
323
-
324
-
325
-
326
-
327
-
328
-
329
-
330
-
331
-
332
-
333
-
334
-
335
-
336
-
337
-
338
-
339
-
340
-
341
-
342
-
343
-
344
-
345
-
346
 |
 |

211
Consolidated
Financial Statements
at 31 December 2012
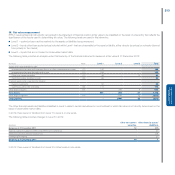
Quantitative information on currency risk
The Group is exposed to risk resulting from changes in exchange rates, which can affect its earnings and equity. In particular:
Where a Group company incurs costs in a currency different from that of its revenues, any change in exchange rates can affect the Operating result of
that company. In 2012, the total trade flows exposed to currency risk amounted to the equivalent of 10% of the Group’s turnover.
The principal exchange rates to which the Group is exposed are the following:
USD/CAD, relating to sales in Canadian Dollars made by Chrysler in Canada;
EUR/USD, relating to sales in US Dollars made by Italian companies (in particular, companies belonging to the Performance and Luxury Brands
operating segment) and to sales in Euro made by Chrysler;
GBP, AUD, MXN, CHF, CNY, ARS and VEF in relation to sales in the UK, Australian, Mexican, Swiss, Chinese, Argentinian and Venezuelan markets;
PLN and TRY, relating to manufacturing costs incurred in Poland and Turkey;
USD/BRL, EUR/BRL, relating to Brazilian manufacturing operations and the related import and export flows.
Taken overall trade flows exposed to changes in these exchange rates in 2012 made up approximately 85% of the exposure to currency risk from trade
transactions.
It is the Group’s policy to use derivative financial instruments to hedge a certain percentage, on average between 55% and 85%, of the forecast trading
transaction exchange risk exposure for the coming 12 months (including such risk beyond that date where it is believed to be appropriate in relation to
the characteristics of the business) and to hedge completely the exposure resulting from firm commitments.
Group companies may find themselves with trade receivables or payables denominated in a currency different from the functional currency of the
company itself. In addition, in a limited number of cases, it may be convenient from an economic point of view, or it may be required under local market
conditions, for companies to obtain finance or use funds in a currency different from the functional currency. Changes in exchange rates may result in
exchange gains or losses arising from these situations. It is the Group’s policy to hedge fully, whenever possible, the exposure resulting from receivables,
payables and securities denominated in foreign currencies different from the company’s functional currency.
Certain of the Group’s subsidiaries are located in countries which are not members of the European monetary union, in particular the United States,
Brazil, Canada, Poland, Serbia, Turkey, Mexico, Argentina, the Czech Republic, India, China and South Africa. As the Group’s reference currency is the
Euro, the income statements of those entities are converted into Euros using the average exchange rate for the period, and while revenues and margins
are unchanged in local currency, changes in exchange rates may lead to effects on the converted balances of revenues, costs and the result in Euro.
The assets and liabilities of consolidated companies whose money of account is different from the Euro may acquire converted values in Euros which differ
as a function of the fluctuation in exchange rates. The effects of these changes are recognised directly in the item Cumulative Translation Adjustments
reserve, included in Other Comprehensive income (see Note 24).
The Group monitors its principal exposure to conversion exchange risk, although there was no specific hedging in this respect at the balance sheet date.
There have been no substantial changes in 2012 in the nature or structure of exposure to currency risk or in the Group’s hedging policies.
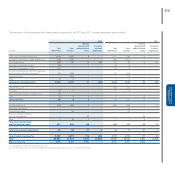
The potential loss in fair value of derivative financial instruments held for currency risk management (currency swaps/forwards, currency options, interest
rate and currency swaps) at 31 December 2012 resulting from a hypothetical, unfavourable and instantaneous change of 10% in the exchange rates of the
leading foreign currencies with the Euro would have been approximately €690 million (€625 million at 31 December 2011).
Receivables, payables and future trade flows whose hedging transactions have been analysed were not considered in this analysis. It is reasonable to
assume that changes in exchange rates will produce the opposite effect, of an equal or greater amount, on the underlying transactions that have been
hedged.