Chrysler 2012 Annual Report Download - page 181
Download and view the complete annual report
Please find page 181 of the 2012 Chrysler annual report below. You can navigate through the pages in the report by either clicking on the pages listed below, or by using the keyword search tool below to find specific information within the annual report.-
 1
1 -
2
-
3
-
4
-
5
-
6
-
7
-
8
-
9
-
10
-
11
-
12
-
13
-
14
-
15
-
16
-
17
-
18
-
19
-
20
-
21
-
22
-
23
-
24
-
25
-
26
-
27
-
28
-
29
-
30
-
31
-
32
-
33
-
34
-
35
-
36
-
37
-
38
-
39
-
40
-
41
-
42
-
43
-
44
-
45
-
46
-
47
-
48
-
49
-
50
-
51
-
52
-
53
-
54
-
55
-
56
-
57
-
58
-
59
-
60
-
61
-
62
-
63
-
64
-
65
-
66
-
67
-
68
-
69
-
70
-
71
-
72
-
73
-
74
-
75
-
76
-
77
-
78
-
79
-
80
-
81
-
82
-
83
-
84
-
85
-
86
-
87
-
88
-
89
-
90
-
91
-
92
-
93
-
94
-
95
-
96
-
97
-
98
-
99
-
100
-
101
-
102
-
103
-
104
-
105
-
106
-
107
-
108
-
109
-
110
-
111
-
112
-
113
-
114
-
115
-
116
-
117
-
118
-
119
-
120
-
121
-
122
-
123
-
124
-
125
-
126
-
127
-
128
-
129
-
130
-
131
-
132
-
133
-
134
-
135
-
136
-
137
-
138
-
139
-
140
-
141
-
142
-
143
-
144
-
145
-
146
-
147
-
148
-
149
-
150
-
151
-
152
-
153
-
154
-
155
-
156
-
157
-
158
-
159
-
160
-
161
-
162
-
163
-
164
-
165
-
166
-
167
-
168
-
169
-
170
-
 171
171 -
 172
172 -
 173
173 -
 174
174 -
 175
175 -
 176
176 -
 177
177 -
 178
178 -
 179
179 -
 180
180 -
 181
181 -
 182
182 -
 183
183 -
 184
184 -
 185
185 -
 186
186 -
 187
187 -
 188
188 -
 189
189 -
 190
190 -
 191
191 -
192
-
193
-
194
-
195
-
196
-
197
-
198
-
199
-
200
-
201
-
202
-
203
-
204
-
205
-
206
-
207
-
208
-
209
-
210
-
211
-
212
-
213
-
214
-
215
-
216
-
217
-
218
-
219
-
220
-
221
-
222
-
223
-
224
-
225
-
226
-
227
-
228
-
229
-
230
-
231
-
232
-
233
-
234
-
235
-
236
-
237
-
238
-
239
-
240
-
241
-
242
-
243
-
244
-
245
-
246
-
247
-
248
-
249
-
250
-
251
-
252
-
253
-
254
-
255
-
256
-
257
-
258
-
259
-
260
-
261
-
262
-
263
-
264
-
265
-
266
-
267
-
268
-
269
-
270
-
271
-
272
-
273
-
274
-
275
-
276
-
277
-
278
-
279
-
280
-
281
-
282
-
283
-
284
-
285
-
286
-
287
-
288
-
289
-
290
-
291
-
292
-
293
-
294
-
295
-
296
-
297
-
298
-
299
-
300
-
301
-
302
-
303
-
304
-
305
-
306
-
307
-
308
-
309
-
310
-
311
-
312
-
313
-
314
-
315
-
316
-
317
-
318
-
319
-
320
-
321
-
322
-
323
-
324
-
325
-
326
-
327
-
328
-
329
-
330
-
331
-
332
-
333
-
334
-
335
-
336
-
337
-
338
-
339
-
340
-
341
-
342
-
343
-
344
-
345
-
346
 |
 |

Notes
180 Consolidated
Financial
Statements
at 31 December
2012
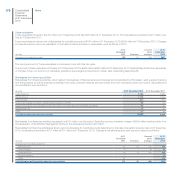
Other comprehensive income
Other comprehensive income may be analysed as follows:
(€ million) 2012 2011
Gains/(losses) on cash flow hedging instruments arising during the year 91 (162)
Gains/(losses) on cash flow hedging instruments reclassified to profit or loss 93 2
Gains/(losses) on cash flow hedging instruments 184 (160)
Gains/(losses) on available-for-sale financial assets arising during the year 27 (42)
Gains/(losses) on available-for-sale financial assets reclassified to profit or loss --
Gains/(Losses) on available-for-sale financial assets 27 (42)
Exchange gains/(losses) on translating foreign operations arising during the year (359) 452
Exchange gains/(losses) on translating foreign operations reclassified to profit or loss --
Exchange gains/(losses) on translating foreign operations (359) 452
Share of Other gains/(losses) of entities accounted for using the equity method arising during the year 4(45)
Share of Other gains/(losses) of entities accounted for using the equity method reclassified to profit or loss 17 (18)
Share of Other gains/(losses) of entities accounted for using the equity method 21 (63)
Tax effect of the other components of Other comprehensive income (24) 15
Total Other comprehensive income, net of tax (151) 202
The losses recognised directly in equity for the fair value adjustment of available-for-sale financial assets are due to a decrease in the fair value of the assets
to which this relates.
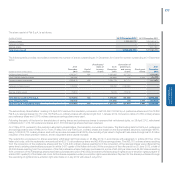
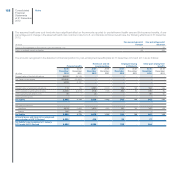
The tax effect relating to Other comprehensive income may be analysed as follows:
2012 2011
(€ million)
Pre-tax
balance
Tax income/
(expense)
Net
balance
Pre-tax
balance
Tax income/
(expense)
Net
balance
Gains/(losses) on cash flow hedging instruments 184 (24) 160 (160) 14 (146)
Gains/(losses) on available-for-sale financial assets 27 - 27 (42) 1 (41)
Exchange gains/(losses) on translating foreign operations (359) - (359) 452 - 452
Share of Other gains/(losses) of entities accounted for using the equity method 21 - 21 (63) - (63)
Total Other comprehensive income (127) (24) (151) 187 15 202
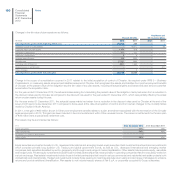
Non-controlling interest
The non-controlling interest of €4,114 million at 31 December 2012 (€3,533 million at 31 December 2011) refers mainly to the following subsidiaries:
(% held by non-controlling interest) At 31 December 2012 At 31 December 2011
Chrysler Group LLC 41.5 46.5
Ferrari S.p.A. 10.0 10.0
Teksid S.p.A. 15.2 15.2